

- Research platform
Sources of information
Data analysis
Actions

- Solutions
For whom
Problems / Issues

- Materials
Materials
- About us
About us
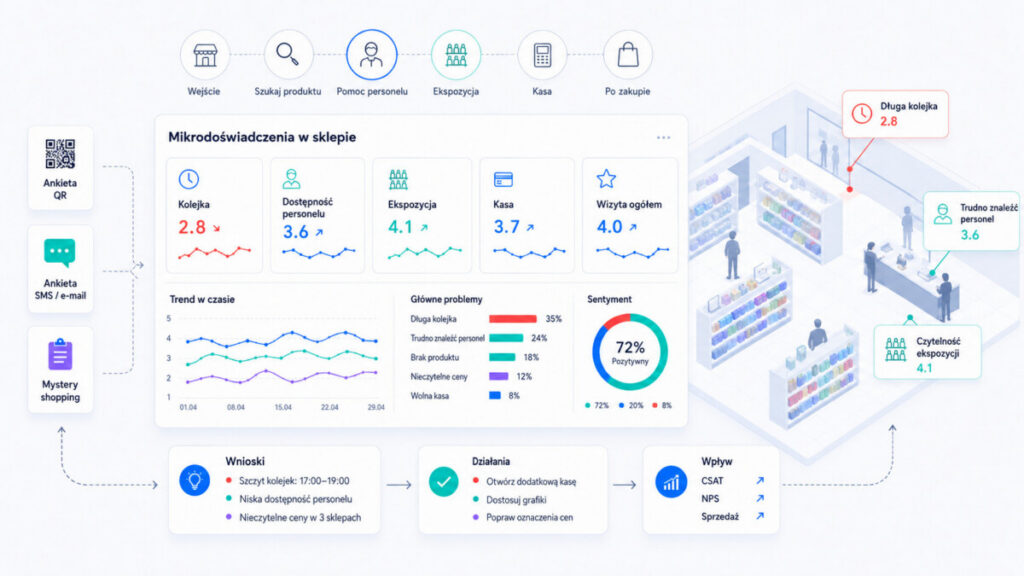
If the question is queues staff availability exposure how to study micro-experiences in retail, the answer doesn't start with a single average store rating, but with a breakdown of the customer path at specific touch points.
In 2024/2025, retail is operating under pressure from costs, wages, energy and rents, while e-commerce competitors are accustoming customers to fast information, clear pricing and convenience. In 2020, many traditional stores are going out of business, showing that stationary retail cannot rely solely on location. Customer experience in retail is the sum of the little things: queuing, finding a product, contacting an employee, checkout, return, additional services and picking up an order. In micro-moments, decisions are made in fractions of seconds, and long wait times are the main reason for shopping cart abandonment. From YourCX's perspective, it can be seen in the data that micro-experiences affect visit satisfaction and frustration levels, and correlate with NPS and shopping cart.

Micro-experiences in retail are single, measurable moments of the customer journey: entry, finding the zone, finding the product, verifying the price, contacting staff, fitting room, checkout, return, online pickup and exit. Each of these can have a separate CSAT, CES or commentary.
In grocery, queuing and clear promotions are key; in fashion, size availability; in consumer electronics/appliances, knowledge and skills of specialists; in DIY, logical division of departments; in pick-up points, clear instructions. Clear information points make purchasing decisions easier. Retail micro-experiences are being explored by sensory technologies: mobile eye-tracking tracks eye movement while shopping, LiDAR sensors monitor traffic density in the checkout area in real time, and counting and heat-mapping systems measure customer movement without cameras.
The question "How would you rate your visit to the store?" is useful, but the complex reality of the store does not fit into a single average. A customer may rate the display well, but the queue poorly; a final rating of 3/5 doesn't tell you what to fix.
Example: The drugstore's NPS is stable, but between 5pm and 7pm the number of comments about the cash registers increases. The manager needs indicators: queue rating, staff availability, promotion readability. The modern Voice of Customer retail breaks down the visit into categories and indicates which points reduce NPS, sales and profitability the most.
In-store queues occur at traditional checkouts, self-service, customer service, click & collect, returns and complaints. Studies show that after about 8-10 minutes, the risk of abandoning a purchase increases, and the length of the queue is sometimes more important than its actual speed(Queuing Study).
At a drugstore, a 2 2 promotion can make Saturday comments suddenly filled with the topic "queue." Too few employees increase service time and frustrate customers. Therefore, POS alone is not enough; it is worth asking the question, "How do you rate the waiting time in the queue?".
Combine subjective rating with number of open checkouts, transactions per hour and number of returns.
An HR report can show full staffing, and customers will still write: "no one helped." Service-related micro-moments research focuses on staff availability: visibility, initiative, competence and courtesy. Satisfaction surveys measure satisfaction with staff assistance, and Mystery Shopping audits assess staff response times and their courtesy.
Ask, "Was it easy to find an employee?", "Did the employee help resolve the issue?", "How do you rate competence?". In fashion separately measure lack of size and lack of help. Indicators: availability score and service quality score.
Product display influences choice, especially in drugstore, fashion, consumer electronics/appliances and DIY. Studies show that the right displays can increase revenue by about 11% on average(ScienceDirect).
Measure: product visibility, category layout, price tags, promotions, variants, sizes, shelf cleanliness and POS materials. In DIY, the customer doesn't find the department or the employee. In grocery, the problem is the difference between the price on the shelf and at checkout. Questions: "Was the product available?", "Was the display clear?", "Were prices and promotions clearly marked?". Merchandising scores and mystery shopping scores help.
The goal is a short survey: 2-4 questions plus open-ended comments. Match questions to the context: purchase, return, pick-up, consultation.
Examples:
Conditional logic makes the customer see fewer questions and better data.
CSAT retail measures point-of-contact satisfaction, CES retail ease of process, NPS retail loyalty to the chain. Add: wait time, availability score, merchandising score, service quality score and mystery shopping score. Conversion rate is the percentage of visitors who make a purchase. The CX platform can count metrics for locations, regions, promotions and seasons.
QR at checkout examines the queue. Link on receipt measures visit and 1-2 micro-experiences. SMS or email after click & collect measures pickup time. Tablet gives quick feedback on exit. Mystery shopper complements customer feedback with standards of service and display. New technologies in commerce allow combining channels in one dashboard.

"The queue was bad" information alone is not enough. Integrate: time, day, traffic, number of transactions, walk-ins, checkout, graphics, stock, promotions, format and location. Sales data is captured at the EAN code level. Retail Tracking monitors in-store and online sales; Retail Tracking research monitors in-store and online sales.
Market analysis includes operational, financial aspects and pricing strategy. Market analysis covers operational and financial aspects. Market analysis identifies opportunities and threats for retail chains. Market research helps increase sales and improve profitability. Effective market research requires a structured approach. Effective market research improves profitability in retail. Effective market research improves profitability in retail.
Margin and operating profitability are key in retail. Price optimization affects retail's bottom line. Profitability analysis should include margin and operating expenses. Margin and profitability analysis is key in retail.
In Poland, chains have dozens or hundreds of sales locations, so benchmarks are needed. Compare similar formats: large DIY with large DIY, malls with malls, retail parks with retail parks. Taking into account square footage, seasonality, share of promotions and customer groups, it's easier to distinguish a weak store from a difficult location. YourCX can show outlier locations from the average and alert regional representatives.
A checkout failure is an incident. Constant queues on Saturdays are a systemic problem. Monitor weekly and monthly trends and tags: queue, checkout, staff, availability, display, price, promotion, cleanliness, return, reception, atmosphere, communication. A systemic error requires a change in strategy, display standard or process; a local incident - a manager's response.
Comments explain the reason for the number: "one checkout open", "no size", "unreadable offer". Automatic tagging in YourCX shortens the analysis of thousands of reviews. In RTV/AGD, the dominance of "staff" and "competence" tags suggests product training, not always more staffing.
Feedback makes sense when you end up with a decision: a change in schedules, an additional cash register, improved signage, a new planogram, training, a better pick-up point. Good assortment planning increases a store's competitiveness. Good product lifecycle management increases profitability. Effective product lifecycle management has four stages. Near-sourcing shortens the supply chain for faster delivery. Effective supplier relationship management increases company profit. Supplier relationship management shortens time-to-market, reduces operational risk and improves transactional efficiency. Good supplier relationships increase market competitiveness.
The most common mistakes are: taking too long a survey, asking everything at once, missing the context of the visit, focusing on the average, missing operational data, missing comparisons, ignoring comments and missing feedback loops. To avoid this, limit the survey, use conditions, integrate POS/ERP, report cyclically and assign accountability. The CX tool should support, not complicate, management.

It's best to start with a pilot in 3-5 locations: mall, retail park, city store and pick-up point. Choose queues, staff and display. After 4-6 weeks, evaluate the quality of the data and only scale.
There is no single number, but practically it is worth aiming for 50-100 surveys per month per store, depending on traffic. Regularity and trends are important, and in smaller stores, quarterly or regional analysis.
Make it clear: "2-3 questions, 30 seconds." Invite right after the visit via QR, receipt or SMS. The form must be mobile, with no login or unnecessary fields.
Use similar metrics in-store and online. Measure click & collect: pickup time, instructions, price compliance and promotions. This way you can see how e commerce and the store together affect customer needs.
Show that feedback is not control, but the basis for improvement. Discuss results at briefings, highlight good comments and give managers simple dashboards.
In retail, one visit evaluation is not enough. Micro-experiences are key: queues, staff availability, display, pricing, pickups and returns. Measuring them helps improve in-store service, increase sales and better control costs. CX platforms, such as YourCX, make it easy to scale research, but the most important thing is the approach: measure, analyze, recommend, act and measure again. It's worthwhile to pick the first 2-3 micro-experiences now and see which ones really determine customer loyalty.
Copyright © 2023. YourCX. All rights reserved — Design by Proformat
