

- Research platform
Sources of information
Data analysis
Actions

- Solutions
For whom
Problems / Issues

- Materials
Materials
- About us
About us
Are you collecting thousands of customer reviews but don’t know where to start? Prioritizing CX issues is a process that transforms the chaos of comments into a structured list of actions. In this article, you’ll find a concrete methodology: from organizing data, through a prioritization matrix and scoring model, to closing the feedback loop.
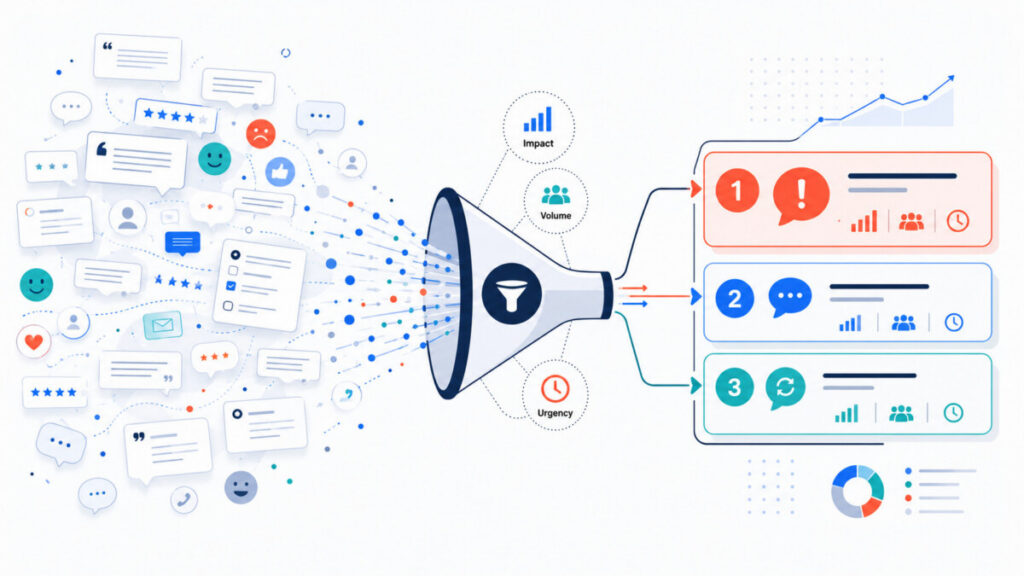
The sheer number of comments isn’t an insight. What’s needed is a process—organizing, classifying, and prioritizing CX issues—that allows you to identify the topics that truly transform the customer experience and the company’s bottom line.
In 2026, a customer experience manager has access to hundreds of NPS, CSAT, and CES surveys, thousands of open-ended comments, reviews from Google Maps and marketplaces, help desk tickets, sales rep notes, data from mobile apps, and UX research results. The volume of feedback is growing faster than the team’s ability to process it.
The problem isn’t a lack of customer voice. Most companies are good at collecting feedback. The real challenge is moving from “too much feedback” to a short list of CX priorities that teams can use to make concrete decisions.
53% of customers stop using a service after a single bad experience, and 73% of customers say that their experience influences their purchasing decisions. These figures show that the decision of “what to address first” should be based on the impact on the customer experience, financial results, and risk—not on the volume of complaints.
The rest of this article outlines a practical, step-by-step methodology for prioritizing CX issues: from organizing data, through scoring and a matrix, to closing the feedback loop.

The most common mistake in customer experience management is treating the number of reports as the sole criterion for prioritization. However, a high-profile problem, a frequent problem, and a critical problem are three different things.
Specific examples:
Pareto analysis focuses on the 20% of causes that generate 80% of the problems. Treat feedback as data to be weighted: count the number of reports, but at the same time take into account sentiment, the stage of the customer journey, segment value, and business impact. Analyzing customer opinions and comments requires a multidimensional approach to feedback management.
A single customer quote is not yet a CX problem or an insight. It is raw feedback that requires context. Regularly monitoring customer feedback identifies recurring issues—but only when the data is organized.
The organization process:
Distinguishing between these concepts is fundamental:
Constructive feedback highlights areas for improvement, but it’s only at the problem and insight levels that you can meaningfully consider CX priorities. A CX platform can automate comment tagging and sentiment analysis, reducing manual work.
A consistent category glossary allows you to compare data over time and across channels. Without it, every report looks different. The category system should be versatile enough to work in e-commerce, retail, services, and SaaS:
Categories should remain stable over time (for comparisons and trends) but flexible within subcategories. Avoid generalities and overly detailed tag taxonomies—hundreds of micro-tags that no one actually uses complicate reports and make the analysis vague. Start by limiting the number of categories to 10–15.
Each criterion below acts as a filter through which you sift the collected feedback. In practice, this means assigning points or ratings to each issue across several dimensions simultaneously.
Scale of the problem —how many customers are affected? Is the trend rising, falling, or seasonal? Does it occur in one channel or multiple channels?
Impact on the customer experience —does the issue generate strong negative emotions? How does it affect the customer effort score? Does it occur during moments of truth: payment, delivery, complaints, onboarding?
Business impact —how does the problem affect conversion, retention, churn, and the number of tickets? Does it increase costs? Increasing the customer retention rate by 5% can lead to a 95% increase in profits—which is why issues that lead to customer churn should be given the highest priority. Prioritize issues whose resolution leads to cost reductions or revenue growth.
Customer segment —does the issue affect high-value customers, new customers, or B2B customers? Does it occur in mobile-first segments or high-potential regions?
Sentiment and emotions —what is the level of negative sentiment? Are there signs of impending churn, such as “this was the last time” or “I’m switching to a competitor”? Negative feedback with such strong emotional weight requires immediate attention.
Customer journey stage — does the problem occur at the beginning, during, or at the end of the journey? Customers feel particularly frustrated when the problem occurs during stages with low tolerance for errors.
Cost and difficulty of resolution —is changing the message content enough, or does the system need to be modified? Does it require several teams, or a single point of contact?
Risk of inaction – the cost of delay assesses the consequences of not resolving the problem in a timely manner. What will happen in a month, a quarter, or a year?
The 2×2 matrix is a tool for quick visual decision-making. Its structure resembles the Eisenhower matrix, which divides issues into four quadrants to establish priorities:
Four groups:
Quick wins are issues with high impact and low implementation cost: clarifying delivery costs, adding a complaint status, improving error message content. The prioritization workshop should involve representatives from CX, product, customer service, and business working together to place the top 20 issues on this matrix.

Scoring should be simple and understandable to managers outside of CX. A 1–5 scale for each dimension:
Example: unclear delivery costs – frequency 4/5, sentiment 5/5, impact on conversion 5/5, segment 4/5 (new customers from a campaign), journey stage 5/5 (payment moment), resolution cost 4/5 (content change). Recommendation: high priority, quick test of cost communication.
The ICE method evaluates problems based on impact, certainty, and ease of resolution—it’s an alternative model you can use if you need a simplified version. Compare two problems and assess which is more important—this makes decision-making easier when scoring results are similar.
Scoring doesn’t have to be perfect. Its role is to facilitate discussion, align perceptions, and reduce the influence of individual opinions on decisions. CX tools automatically calculate frequency and sentiment, but assessing cost and risk requires input from business owners.
NPS, CSAT, and CES numbers alone aren’t enough. The real value lies in combining them with the content of comments and metadata (channel, segment, product).
NPS – Issues frequently cited by detractors (0–6) are highly likely to impact customer loyalty and churn. It’s worth analyzing the themes that emerge in the “What influenced your rating?” responses from detractors and passives. Customer feedback should guide service improvements.
CSAT – Low scores at specific stages (complaints, contact with the helpline, delivery) indicate where the customer experience is actually falling short. Correlate CSAT with operational data: turnaround time, number of contacts.
CES – The Customer Effort Score measures how easily customers can achieve their goals. A high CES is a strong signal that the process requires effort and generates costs. Issues with a high CES are natural candidates for CX priorities.
Example: In SaaS, a low NPS and high CES during the onboarding phase for new B2B customers should lead to prioritizing a redesign of the onboarding process, even if the company’s overall NPS looks good. CX platforms make it easier to link metrics to comment content, which speeds up the identification of the most impactful issues.
The same problem may carry different weight across different segments. CX priorities should be set based on segmentation, not on averages that “smooth over” issues affecting important groups.
Example segments:
E-commerce: Mobile checkout issues—an average 2% drop in conversion, but among 18–24-year-old customers from social media campaigns, the drop is 8%. This issue is given the highest priority.
SaaS: Difficulties onboarding customers who switched from competitors lead to higher churn in the first 90 days—even though the overall CSAT is acceptable.
Not every negative comment requires a process change. A strategic approach requires distinguishing between:
Systemic problem – recurs over time, across different channels, affects a larger group of customers, has similar causes, impacts metrics (decline in NPS, CSAT; increase in CES), and generates costs or risk. Example: A series of similar complaints about damaged packages across several stores is a systemic problem (logistics, supplier). In SaaS, 30 similar support tickets following a feature release constitute a systemic problem.
Incident – a one-time event affecting a specific customer in a specific situation; it requires a service recovery response (apology, compensation) and does not always warrant a process change. Fixing an error for a specific person is customer service, not a CX transformation.
Both types require a response, but different ones: an incident calls for quick, individualized assistance. A system-wide issue requires root cause analysis and a plan to change the process or product.
Different sources of feedback offer different “perspectives” on the customer experience:
Public feedback tends to be more emotional. Transactional surveys are more closely tied to the specific experience. Support data shows actively reported issues. Behavioral data reveals specific behaviors but does not explain the causes.
A topic that appears across NPS surveys, support tickets, and social media has a higher priority than one that appears in only a single channel. A CX platform aggregates the voice of the customer from various sources in one place and displays real-time alerts for emerging issues.
Some issues are costly, involve multiple teams, or are constrained by regulations. Delegating tasks among IT, operations, legal, and external partners takes time. A practical approach:
Example: If you can’t shorten delivery time from 5 to 2 days, you can improve how the estimated delivery date is presented, introduce SMS notifications about package status, and offer delivery to a package locker. For “long-term” issues, it’s still worth assessing the scale and impact to justify investments. Responding quickly to feedback prevents customer churn even when a full solution takes months. Focus on solving up to three key problems at any given time, rather than spreading your efforts across twenty issues simultaneously.
A list of CX issues without assigned owners and deadlines becomes a report rather than a tool for change. For each priority customer issue, define:
Example: vague error message in the address form. Owner: product owner / UX lead. Action: Redesign the validation process; clarify the message content. Metrics: Decrease in error rate, increase in completion rate, decrease in CES. Timeline: Next sprint. Introduce a monthly “CX priorities review” meeting where teams update their status. Avoid generalities—specific guidelines and metrics are the foundation of every plan.
Customers don’t just expect surveys. They expect a visible response to their feedback. Without a closed feedback loop, feedback becomes a report rather than a tool for improvement. 69% of employees would work harder with better feedback—this principle also applies to the company–customer relationship.
Closed-loop diagram:
Companies with a customer feedback loop system see a 10% increase in satisfaction. Incorporating customer feedback into a closed-loop system increases customer satisfaction by 15% and fosters a culture of continuous improvement. Companies using this approach see a 10% increase in customer retention.
Communication examples: “Based on customer feedback, we’ve simplified the return process from 6 to 3 steps”—an email to NPS respondents about the changes made. Recognizing customers who share honest feedback builds trust and encourages them to continue providing feedback. Satisfied customers are more likely to return and recommend the company to others.
What to avoid in the prioritization process:
Positive feedback reinforces desired behaviors and solutions—it’s worth analyzing it alongside negative feedback to understand what works. 53% of customers stop using a service after a bad experience, so each of the above mistakes has a huge impact on a company’s results.
With thousands of comments per year, manual analysis is ineffective. A customer experience and Voice of the Customer (VoC) platform streamlines feedback management, acting as the “central nervous system” for the voice of the customer. VoC tools help set priorities based on the number of reports, sentiment, and impact.
Practical benefits:
Solutions like YourCX facilitate the transition from data to decisions. They help develop the team’s data analysis skills, but the platform itself cannot replace process maturity and a customer-centric culture within a large organization or the CX team’s work environment. Regular feedback from the platform enables the team to work based on data, not intuition—and this is what distinguishes mature VoC programs from nascent ones, even in large companies and workplaces where change management requires mutual respect and understanding between teams.

The table below can serve as a checklist for workshops with business teams:
Criterion | Guiding Question | Example of a signal | Impact on priority | Recommended response |
|---|---|---|---|---|
Problem scale | How many customers has this affected in the last 30 days? | 40% increase in payment-related comments in Q3 | High, if the trend is rising | Root cause analysis, change initiative |
Impact on the customer | Does it cause frustration or a loss of trust? | Phrases like “never again,” “last time” | High when emotions are running high | Strategic priority |
Business impact | Does it affect conversion, churn, or costs? | 5% drop in checkout completion rate | Very high | Quick win or IT project |
Customer segment | Does this affect high-value or new customers? | Problem visible only in B2B with MRR >10k | High for high-value segments | Dedicated segment analysis |
Journey stage | Does this apply to the moment of truth? | Errors during the payment or onboarding stage | High at critical stages | Immediate intervention |
Cost of the solution | Is a content change sufficient, or does it require IT? | Changing the message vs. system redesign | Low cost = quick win | Quick win in communication |
Risk of inaction | What about monthly or quarterly? | Rising churn, regulatory risk | High in the event of escalation | Monitoring the roadmap |
Below are three hypothetical issues rated on a scale of 1–5 (5 = highest impact / easiest to solve):
Dimension | P1: Unclear delivery costs | P2: Long support response times | P3: The newsletter is hard to read |
|---|---|---|---|
Frequency | 4 | 3 | 4 |
Negative sentiment | 5 | 4 | 2 |
Impact on NPS/CSAT/CES | 5 | 4 | 2 |
Business Impact | 5 | 4 | 1 |
Segment Importance | 4 | 3 | 2 |
Cost of the solution (ease) | 4 | 2 | 4 |
Total | 27 | 20 | 15 |
P1 has the highest score—high impact and low solution cost. P2 has a high impact on CES and costs, but a higher solution cost (recruitment, automation). P3—despite frequent comments—has a low level of business impact and is a candidate for medium priority. This comparison helps demonstrate to management why not all “popular” issues are the top CX priority. How does effective feedback management differ from reactive firefighting? It’s precisely the ability to score issues and provide feedback to teams regarding expectations for future actions.
Questions to ask for each CX issue. Issues for which the majority of answers are “yes” should be at the top of the list for the upcoming quarter:
73% of customers say that their experience influences their purchasing decisions. Every “yes” on the list above is a sign that constructive feedback cannot be ignored. The post’s navigation allows you to return to the section with the matrix or scoring to apply these tools to specific scenarios in the personal and professional lives of the CX team.
Below are the most common questions about prioritizing customer feedback and managing the customer experience.
At least once a quarter, with additional ad hoc reviews during new implementations, seasonal events (e.g., Black Friday), or crises. In e-commerce and SaaS—even monthly, if the volume of feedback is very high. The “sandwich method”—combining positive observations with issues—also works well as a way to communicate during review meetings.
A CX or Voice of Customer (VoC) specialist or team is responsible for the process, but decisions should be made jointly with representatives from product, customer service, sales, operations, and marketing. A sponsor on the executive board plays a key role in ensuring that CX priorities translate into budgets, commitment, and solutions. The FUKO method, the SBI method, and the FUKO model are tools that help employees provide constructive feedback within the organization. Among the best-known methods for providing feedback in the workplace, it’s also worth mentioning the “next time” approach, which focuses on future actions. The question of who is responsible should not be left unanswered—understanding roles and decision-making skills is important both in personal life and in the workplace.
It isn’t necessary to start with. A simple tagging and scoring model can be implemented manually. AI (natural language processing, automatic tagging, sentiment analysis) significantly speeds up work at scale, but it cannot replace business decisions and an understanding of context. It’s worth providing feedback to AI tools by calibrating the models based on manual reviews of sample comments.
Combine automated methods (topic clustering, sentiment analysis in a CX tool) with periodic, manual in-depth reviews—where the team reads a sample of comments. It’s a good idea to limit the length of open-ended questions and ask them at specific points in the customer journey, rather than “everywhere.” Honest feedback from customers is more valuable than a large number of short, generic responses.
Feedback is raw input: a single comment or rating. A CX insight is a generalized observation derived from multiple signals, with an understanding of cause and effect. An insight always leads to a recommendation for action; feedback alone does not. In practice, this means that both positive and negative feedback are raw material—only the analysis of multiple signals yields an insight that can be used to plan improvements.
An excess of feedback doesn’t have to mean chaos—if a company has consistent categories for CX issues, a process for moving from comments to insights, a prioritization matrix, a simple scoring system, and clear owners of actions with regular reviews of priorities.
Prioritizing CX issues isn’t about responding to everything. It’s about responding to what truly changes the customer experience and the company’s bottom line. CX leaders have achieved more than twice the revenue growth of companies lagging behind in this area —the results speak for themselves.
Start with a customer journey map, a few consistent categories, a simple scoring model (1–5), and monthly review sessions involving representatives from CX, product, and customer service. Only after you’ve organized your CX priorities should you scale your Voice of the Customer program, automate analysis, and develop more advanced models—that’s when every piece of new feedback will truly inform business decisions.
Are you collecting thousands of customer opinions but don’t know where to start? Prioritizing CX issues is a process that transforms the chaos of comments into a structured list of actions. In this article, you’ll find a concrete methodology: from organizing data, through a prioritization matrix and scoring model, to closing the feedback loop.
The sheer number of comments isn’t an insight in itself. What’s needed is a process—organizing, classifying, and prioritizing CX issues—that allows you to identify the topics that truly transform the customer experience and the company’s bottom line.
In 2026, a customer experience manager has access to hundreds of NPS, CSAT, and CES surveys, thousands of open-ended comments, reviews from Google Maps and marketplaces, help desk tickets, sales rep notes, data from mobile apps, and UX research results. The volume of feedback is growing faster than the team’s ability to process it.
The problem isn’t a lack of customer voice. Most companies are good at collecting feedback. The real challenge is moving from “too much feedback” to a short list of CX priorities that teams can use to make concrete decisions.
53% of customers stop using a service after a single bad experience, and 73% of customers say that their experience influences their purchasing decisions. These figures show that the decision of “what to address first” should be based on the impact on the customer experience, financial results, and risk—not on the volume of complaints.
The rest of this article outlines a practical, step-by-step methodology for prioritizing CX issues: from organizing data, through scoring and a matrix, to closing the feedback loop.
The most common mistake in customer experience management is treating the number of reports as the sole criterion for prioritization. However, a high-profile problem, a frequent problem, and a critical problem are three different things.
Specific examples:
Pareto analysis focuses on the 20% of causes that generate 80% of the problems. Treat feedback as data to be weighted: count the number of reports, but at the same time take into account sentiment, the stage of the customer journey, segment value, and business impact. Analyzing customer opinions and comments requires a multidimensional approach to feedback management.
A single customer quote is not yet a CX problem or an insight. It is raw feedback that requires context. Regularly monitoring customer feedback identifies recurring issues—but only when the data is organized.
The organization process:
Distinguishing between these concepts is fundamental:
Constructive feedback highlights areas for improvement, but it’s only at the problem and insight levels that you can meaningfully consider CX priorities. A CX platform can automate comment tagging and sentiment analysis, reducing manual work.
A consistent category glossary allows you to compare data over time and across channels. Without it, every report looks different. The category system should be versatile enough to work in e-commerce, retail, services, and SaaS:
Categories should remain stable over time (for comparisons and trends) but flexible within subcategories. Avoid generalities and overly detailed tag taxonomies—hundreds of micro-tags that no one actually uses complicate reports and make the analysis vague. Start by limiting the number of categories to 10–15.
Each criterion below acts as a filter through which you sift the collected feedback. In practice, this means assigning points or ratings to each issue across several dimensions simultaneously.
Scale of the problem —how many customers are affected? Is the trend rising, falling, or seasonal? Does it occur in one channel or multiple channels?
Impact on the customer experience —does the issue generate strong negative emotions? How does it affect the customer effort score? Does it occur during moments of truth: payment, delivery, complaints, onboarding?
Business impact —how does the problem affect conversion, retention, churn, and the number of tickets? Does it increase costs? Increasing the customer retention rate by 5% can lead to a 95% increase in profits—which is why issues that lead to customer churn should be given the highest priority. Prioritize issues whose resolution leads to cost reductions or revenue growth.
Customer segment —does the issue affect high-value customers, new customers, or B2B customers? Does it occur in mobile-first segments or high-potential regions?
Sentiment and emotions —what is the level of negative sentiment? Are there signs of impending churn, such as “this was the last time” or “I’m switching to a competitor”? Negative feedback with such strong emotional weight requires immediate attention.
Customer journey stage — does the problem occur at the beginning, during, or at the end of the journey? Customers feel particularly frustrated when the problem occurs during stages with low tolerance for errors.
Cost and difficulty of resolution —is changing the message content enough, or does the system need to be modified? Does it require several teams, or a single point of contact?
Risk of inaction – the cost of delay assesses the consequences of not resolving the problem in a timely manner. What will happen in a month, a quarter, or a year?
The 2×2 matrix is a tool for quick visual decision-making. Its structure resembles the Eisenhower matrix, which divides issues into four quadrants to establish priorities:
Four groups:
Quick wins are issues with high impact and low implementation cost: clarifying delivery costs, adding a complaint status, improving error message content. The prioritization workshop should involve representatives from CX, product, customer service, and business working together to place the top 20 issues on this matrix.
Scoring should be simple and understandable to managers outside of CX. A 1–5 scale for each dimension:
Example: unclear delivery costs – frequency 4/5, sentiment 5/5, impact on conversion 5/5, segment 4/5 (new customers from a campaign), journey stage 5/5 (payment moment), resolution cost 4/5 (content change). Recommendation: high priority, quick test of cost communication.
The ICE method evaluates problems based on impact, certainty, and ease of resolution—it’s an alternative model you can use if you need a simplified version. Compare two problems and assess which is more important—this makes decision-making easier when scoring results are similar.
Scoring doesn’t have to be perfect. Its role is to facilitate discussion, align perceptions, and reduce the influence of individual opinions on decisions. CX tools automatically calculate frequency and sentiment, but assessing cost and risk requires input from business owners.
NPS, CSAT, and CES numbers alone aren’t enough. The real value lies in combining them with the content of comments and metadata (channel, segment, product).
NPS – Issues frequently cited by detractors (0–6) have a high potential to impact customer loyalty and churn. It’s worth analyzing the themes that emerge in the “What influenced your rating?” responses from detractors and passives. Customer feedback should guide service improvements.
CSAT – Low scores at specific stages (complaints, contact with the helpline, delivery) indicate where the customer experience is actually falling short. Correlate CSAT with operational data: turnaround time, number of contacts.
CES – The Customer Effort Score measures how easily customers can achieve their goals. A high CES is a strong signal that the process requires effort and generates costs. Issues with a high CES are natural candidates for CX priorities.
Example: In SaaS, a low NPS and high CES during the onboarding phase for new B2B customers should lead to prioritizing a redesign of the onboarding process, even if the company’s overall NPS looks good. CX platforms make it easier to link metrics to comment content, which speeds up the identification of the most impactful issues.
The same problem may carry different weight across different segments. CX priorities should be set based on segmentation, not on averages that “smooth out” the problems of important groups.
Example segments:
E-commerce: Mobile checkout issues—an average 2% drop in conversion, but among 18–24-year-old customers from social media campaigns, the drop is 8%. This issue is given the highest priority.
SaaS: Difficulties onboarding customers who switched from competitors lead to higher churn in the first 90 days—even though the overall CSAT is acceptable.
Not every negative comment requires a process change. A strategic approach requires distinguishing between:
Systemic problem – recurs over time, across various channels, affects a larger group of customers, has similar causes, impacts metrics (decline in NPS, CSAT; increase in CES), and generates costs or risk. Example: A series of similar complaints about damaged packages across several stores is a systemic problem (logistics, supplier). In SaaS, 30 similar support tickets following a feature release constitute a systemic problem.
Incident – a one-time event affecting a specific customer in a specific situation; it requires a service recovery response (apology, compensation) and does not always warrant a process change. Fixing an error for a specific person is customer service, not a CX transformation.
Both types require a response, but different ones: an incident calls for quick, individualized assistance. A system-wide issue requires root cause analysis and a plan to change the process or product.
Different sources of feedback offer different “perspectives” on the customer experience:
Public feedback tends to be more emotional. Transactional surveys are closer to the specific experience. Support data shows actively reported issues. Behavioral data reveals specific behaviors but does not explain the causes.
A topic that appears across NPS surveys, support tickets, and social media has a higher priority than one that appears in only a single channel. A CX platform aggregates the voice of the customer from various sources in one place and displays real-time alerts for emerging issues.
Some issues are costly, involve multiple teams, or are constrained by regulations. Delegating tasks among IT, operations, legal, and external partners takes time. A practical approach:
Example: If you can’t shorten delivery time from 5 to 2 days, you can improve how the estimated delivery date is displayed, introduce SMS notifications about package status, and offer delivery to a package locker. For “long-term” issues, it’s still worth assessing the scale and impact to justify investments. Responding quickly to feedback prevents customer churn even when a full solution takes months. Focus on solving up to three key problems at any given time, rather than spreading your efforts across twenty issues simultaneously.
A list of CX issues without owners and deadlines becomes a report rather than a tool for change. For each priority customer issue, define:
Example: vague error message in the address form. Owner: product owner / UX lead. Action: Redesign the validation process and clarify the message content. Metrics: Decrease in error rate, increase in completion rate, decrease in CES. Timeline: Next sprint. Introduce a monthly “CX priorities review” meeting where teams update the status. Avoid generalities—specific guidelines and metrics are the foundation of every plan.
Customers don’t just expect surveys. They expect a visible response to their feedback. Without a closed feedback loop, feedback becomes a report rather than a tool for improvement. 69% of employees would work harder with better feedback—this principle also applies to the company–customer relationship.
Closed-loop diagram:
Companies with a customer feedback loop system see a 10% increase in satisfaction. Incorporating customer feedback into a closed-loop process increases customer satisfaction by 15% and fosters a culture of continuous improvement. Companies using this approach see a 10% increase in customer retention.
Communication examples: “Based on customer feedback, we’ve simplified the return process from 6 to 3 steps”—an email to NPS respondents about the changes made. Recognizing customers who share honest feedback builds trust and encourages them to continue providing feedback. Satisfied customers are more likely to return and recommend the company to others.
What to avoid in the prioritization process:
Positive feedback reinforces desired behaviors and solutions—it’s worth analyzing it alongside negative feedback to understand what works. 53% of customers stop using a service after a bad experience, so each of the above mistakes has a huge impact on a company’s results.
With thousands of comments per year, manual analysis is ineffective. A customer experience and Voice of the Customer (VoC) platform streamlines feedback management, acting as the “central nervous system” for the voice of the customer. VoC tools help set priorities based on the number of reports, sentiment, and impact.
Practical benefits:
Solutions like YourCX facilitate the transition from data to decisions. They help develop the team’s data analysis skills, but the platform itself cannot replace process maturity and a customer-centric culture within a large organization or the CX team’s work environment. Regular feedback from the platform enables the team to work based on data, not intuition—and this is what distinguishes mature VoC programs from nascent ones, even in large companies and workplaces where change management requires mutual respect and understanding between teams.
The table below can serve as a checklist for workshops with business teams:
Criterion | Guiding Question | Example of a signal | Impact on priority | Recommended response |
|---|---|---|---|---|
Problem scale | How many customers has this affected in the last 30 days? | 40% increase in payment-related comments in Q3 | High, if the trend is rising | Root cause analysis, change initiative |
Impact on the customer | Does it cause frustration or a loss of trust? | Phrases like “never again,” “last time” | High when emotions are running high | Strategic priority |
Business impact | Does it affect conversion, churn, or costs? | 5% drop in checkout completion rate | Very high | Quick win or IT project |
Customer segment | Does this affect high-value or new customers? | Problem visible only in B2B with MRR >10k | High for high-value segments | Dedicated segment analysis |
Journey stage | Does this apply to the moment of truth? | Errors during the payment or onboarding stage | High at critical stages | Immediate intervention |
Cost of the solution | Is a content change sufficient, or does it require IT? | Changing the message vs. system redesign | Low cost = quick win | Quick win in communication |
Risk of inaction | What about monthly or quarterly? | Rising churn, regulatory risk | High in the event of escalation | Monitoring the roadmap |
Below are three hypothetical issues rated on a scale of 1–5 (5 = highest impact / easiest to solve):
Dimension | P1: Unclear delivery costs | P2: Long support response times | P3: The newsletter is hard to read |
|---|---|---|---|
Frequency | 4 | 3 | 4 |
Negative sentiment | 5 | 4 | 2 |
Impact on NPS/CSAT/CES | 5 | 4 | 2 |
Business Impact | 5 | 4 | 1 |
Segment Importance | 4 | 3 | 2 |
Cost of the solution (ease) | 4 | 2 | 4 |
Total | 27 | 20 | 15 |
P1 has the highest score—high impact and low solution cost. P2 has a high impact on CES and costs, but a higher solution cost (recruitment, automation). P3—despite frequent comments—has a low level of business impact and is a candidate for medium priority. This comparison helps demonstrate to management why not all “popular” issues are the top CX priority. How does effective feedback management differ from reactive firefighting? It’s precisely the ability to score issues and provide feedback to teams regarding expectations for future actions.
Questions to ask for each CX issue. Issues for which the majority of answers are “yes” should be at the top of the list for the upcoming quarter:
73% of customers say that their experience influences their purchasing decisions. Every “yes” on the list above is a sign that constructive feedback cannot be ignored. The post’s navigation allows you to return to the section with the matrix or scoring to apply these tools to specific scenarios in the personal and professional lives of the CX team.
Below are the most common questions about prioritizing customer feedback and managing the customer experience.
At least once a quarter, with additional ad hoc reviews during new implementations, seasonal events (e.g., Black Friday), or crises. In e-commerce and SaaS—even monthly if the volume of feedback is very high. The “sandwich method”—combining positive observations with issues—also works well as a way to present findings during review meetings.
A CX or Voice of Customer (VoC) specialist or team is responsible for the process, but decisions should be made jointly with representatives from product, customer service, sales, operations, and marketing. A sponsor on the executive board plays a key role in ensuring that CX priorities translate into budgets, commitment, and solutions. The FUKO method, the SBI method, and the FUKO model are tools that help employees provide constructive feedback within the organization. Among the best-known methods for providing feedback in the workplace, it’s also worth mentioning the “next time” approach, which focuses on future actions. The question of who is responsible should not be left unanswered—understanding roles and decision-making skills is important both in personal life and in the workplace.
It isn’t necessary to start with. A simple tagging and scoring model can be implemented manually. AI (natural language processing, automatic tagging, sentiment analysis) significantly speeds up work at scale, but it cannot replace business decisions and an understanding of context. It’s worth providing feedback to AI tools by calibrating the models based on manual reviews of sample comments.
Combine automated methods (topic clustering, sentiment analysis in a CX tool) with periodic, manual in-depth reviews—where the team reads a sample of comments. It’s a good idea to limit the length of open-ended questions and ask them at specific points in the customer journey, rather than “everywhere.” Honest feedback from customers is more valuable than a large number of short, generic responses.
Feedback is raw input: a single comment or rating. A CX insight is a generalized observation drawn from multiple signals, accompanied by an understanding of cause and effect. An insight always leads to a recommendation for action; feedback alone does not. In practice, this means that both positive and negative feedback are raw material—only the analysis of multiple signals yields an insight, which can then be used to plan improvements.
An excess of feedback doesn’t have to mean chaos—if a company has consistent CX issue categories, a process for turning feedback into insights, a prioritization matrix, a simple scoring system, and clear owners for each action with regular reviews of priorities.
Prioritizing CX issues isn’t about responding to everything. It’s about responding to what truly changes the customer experience and the company’s bottom line. CX leaders have achieved more than twice the revenue growth of companies lagging behind in this area —the results speak for themselves.
Start with a customer journey map, a few consistent categories, a simple scoring model (1–5), and monthly review sessions involving representatives from CX, product, and customer service. Only after you’ve organized your CX priorities should you scale your Voice of the Customer program, automate analysis, and develop more advanced models—that’s when every piece of new feedback will truly drive business decisions.
Are you collecting thousands of customer opinions but don’t know where to start? Prioritizing CX issues is a process that transforms the chaos of comments into a structured list of actions. In this article, you’ll find a concrete methodology: from organizing data, through a prioritization matrix and scoring model, to closing the feedback loop.
The sheer number of comments isn’t an insight. What’s needed is a process—organizing, classifying, and prioritizing CX issues—that allows you to identify the topics that truly transform the customer experience and the company’s bottom line.
In 2026, a customer experience manager has access to hundreds of NPS, CSAT, and CES surveys, thousands of open-ended comments, reviews from Google Maps and marketplaces, help desk tickets, sales rep notes, data from mobile apps, and UX research results. The volume of feedback is growing faster than the team’s ability to process it.
The problem isn’t a lack of customer voice. Most companies are good at collecting feedback. The real challenge is moving from “too much feedback” to a short list of CX priorities that teams can use to make concrete decisions.
53% of customers stop using a service after a single bad experience, and 73% of customers say that their experience influences their purchasing decisions. These figures show that the decision of “what to address first” should be based on the impact on the customer experience, financial results, and risk—not on the volume of complaints.
The rest of this article outlines a practical, step-by-step methodology for prioritizing CX issues: from organizing data, through scoring and a matrix, to closing the feedback loop.
The most common mistake in customer experience management is treating the number of reports as the sole criterion for prioritization. However, a high-profile problem, a frequent problem, and a critical problem are three different things.
Specific examples:
Pareto analysis focuses on the 20% of causes that generate 80% of the problems. Treat feedback as data to be weighted: count the number of reports, but at the same time take into account sentiment, the stage of the customer journey, segment value, and business impact. Analyzing customer opinions and comments requires a multidimensional approach to feedback management.
A single customer quote is not yet a CX problem or an insight. It is raw feedback that requires context. Regular monitoring of customer opinions identifies recurring issues—but only when the data is organized.
The organization process:
Distinguishing between these concepts is fundamental:
Constructive feedback highlights areas for improvement, but it’s only at the problem and insight levels that you can meaningfully consider CX priorities. A CX platform can automate comment tagging and sentiment analysis, reducing manual work.
A consistent category glossary allows you to compare data over time and across channels. Without it, every report looks different. The category system should be versatile enough to work in e-commerce, retail, services, and SaaS:
Categories should remain stable over time (for comparisons and trends) but flexible within subcategories. Avoid generalities and overly detailed tag taxonomies—hundreds of micro-tags that no one actually uses complicate reports and make the analysis vague. Start by limiting the number of categories to 10–15.
Each criterion below acts as a filter through which you sift the collected feedback. In practice, this means assigning points or ratings to each issue across several dimensions simultaneously.
Scale of the problem —how many customers are affected? Is the trend rising, falling, or seasonal? Does it occur in one channel or multiple channels?
Impact on the customer experience —does the issue generate strong negative emotions? How does it affect the customer effort score? Does it occur during moments of truth: payment, delivery, complaints, onboarding?
Business impact —how does the problem affect conversion, retention, churn, and the number of tickets? Does it increase costs? Increasing the customer retention rate by 5% can lead to a 95% increase in profits—which is why issues that lead to customer churn should be given the highest priority. Prioritize issues whose resolution leads to cost reductions or revenue growth.
Customer segment —does the issue affect high-value customers, new customers, or B2B customers? Does it occur in mobile-first segments or high-potential regions?
Sentiment and emotions — what is the level of negative sentiment? Are there signs of impending churn, such as “this was the last time” or “I’m switching to a competitor”? Negative feedback with such strong emotional weight requires immediate attention.
Customer journey stage — does the problem occur at the beginning, during, or at the end of the journey? Customers feel particularly frustrated when the problem occurs at stages with low tolerance for errors.
Cost and difficulty of resolution —is changing the message content enough, or does the system need to be modified? Does it require several teams, or a single point of contact?
Risk of inaction – the cost of delay assesses the consequences of not resolving the problem in a timely manner. What will happen in a month, a quarter, or a year?
The 2×2 matrix is a tool for quick visual decision-making. Its structure resembles the Eisenhower matrix, which divides issues into four quadrants to establish priorities:
Four groups:
Quick wins are issues with high impact and low implementation cost: clarifying delivery costs, adding a complaint status, improving error message content. The prioritization workshop should involve representatives from CX, product, support, and business working together to place the top 20 issues on this matrix.
Scoring should be simple and understandable to managers outside of CX. A 1–5 scale for each dimension:
Example: unclear delivery costs – frequency 4/5, sentiment 5/5, impact on conversion 5/5, segment 4/5 (new customers from a campaign), journey stage 5/5 (payment moment), cost of resolution 4/5 (content change). Recommendation: high priority, quick test of cost communication.
The ICE method evaluates problems based on impact, certainty, and ease of resolution—it’s an alternative model you can use if you need a simplified version. Compare two problems and assess which is more important—this makes decision-making easier when scoring results are similar.
Scoring doesn’t have to be perfect. Its role is to facilitate discussion, align perceptions, and reduce the influence of individual opinions on decisions. CX tools automatically calculate frequency and sentiment, but assessing cost and risk requires input from business owners.
NPS, CSAT, and CES numbers alone aren’t enough. The real value lies in combining them with the content of comments and metadata (channel, segment, product).
NPS – Issues frequently cited by detractors (0–6) are highly likely to impact customer loyalty and churn. It’s worth analyzing the themes that emerge in the “What influenced your rating?” responses from detractors and passives. Customer feedback should guide service improvements.
CSAT – Low scores at specific stages (complaints, contact with the helpline, delivery) indicate where the customer experience is actually falling short. Correlate CSAT with operational data: turnaround time, number of contacts.
CES – The Customer Effort Score measures how easily customers can achieve their goals. A high CES is a strong signal that the process requires effort and generates costs. Issues with a high CES are natural candidates for CX priorities.
Example: In SaaS, a low NPS and high CES during the onboarding phase for new B2B customers should lead to prioritizing a redesign of the onboarding process, even if the company’s overall NPS looks good. CX platforms make it easier to link metrics to comment content, which speeds up the identification of the most impactful issues.
The same problem may carry different weight across different segments. CX priorities should be set based on segmentation, not on averages that “smooth over” issues affecting key groups.
Example segments:
E-commerce: Mobile checkout issues—an average 2% drop in conversion, but among 18–24-year-old customers from social media campaigns, the drop is 8%. This issue is given the highest priority.
SaaS: Difficulties onboarding customers who switched from competitors lead to higher churn in the first 90 days—even though the overall CSAT is acceptable.
Not every negative comment requires a process change. A strategic approach requires distinguishing between:
Systemic problem – recurs over time, across various channels, affects a larger group of customers, has similar causes, impacts metrics (decline in NPS, CSAT; increase in CES), and generates costs or risk. Example: A series of similar complaints about damaged packages across several stores is a systemic problem (logistics, supplier). In SaaS, 30 similar support tickets following a feature release constitute a systemic problem.
Incident – a one-time event affecting a specific customer in a specific situation; it requires a service recovery response (apology, compensation) and does not always warrant a process change. Fixing an error for a specific person is customer service, not a CX transformation.
Both types require a response, but different ones: an incident calls for quick, individualized assistance. A system-wide issue requires root cause analysis and a plan to change the process or product.
Different sources of feedback offer different “perspectives” on the customer experience:
Public feedback tends to be more emotional. Transactional surveys are closer to the specific experience. Support reveals actively reported issues. Behavioral data shows specific behaviors but does not explain the causes.
A topic that appears across NPS surveys, support tickets, and social media has a higher priority than one that appears in only a single channel. A CX platform aggregates the voice of the customer from various sources in one place and displays real-time alerts for emerging issues.
Some issues are costly, involve multiple teams, or are constrained by regulations. Delegating tasks among IT, operations, legal, and external partners takes time. A practical approach:
Example: If you can’t shorten delivery time from 5 to 2 days, you can improve how the estimated delivery date is presented, introduce SMS notifications about package status, and offer delivery to a package locker. For “long-term” issues, it’s still worth assessing the scale and impact to justify investments. Responding quickly to feedback prevents customer churn even when a full solution takes months. Focus on solving up to three key problems at any given time, rather than spreading your efforts across twenty issues simultaneously.
A list of CX issues without assigned owners and deadlines becomes a report rather than a tool for change. For each priority customer issue, define:
Example: vague error message in the address form. Owner: product owner / UX lead. Action: Redesign the validation process and clarify the message content. Metrics: Decrease in error rate, increase in completion rate, decrease in CES. Timeline: Next sprint. Introduce a monthly “CX priorities review” meeting where teams update the status. Avoid generalities—specific guidelines and metrics are the foundation of every plan.
Customers don’t just expect surveys. They expect a visible response to their feedback. Without a closed feedback loop, feedback becomes a report rather than a tool for improvement. 69% of employees would work harder with better feedback—this principle also applies to the company–customer relationship.
Closed-loop diagram:
Companies with a customer feedback loop system see a 10% increase in satisfaction. Incorporating customer feedback into a closed-loop system increases customer satisfaction by 15% and fosters a culture of continuous improvement. Companies using this approach see a 10% increase in customer retention.
Communication examples: “Based on customer feedback, we’ve simplified the return process from 6 to 3 steps,” an email to NPS respondents about the changes made. Recognizing customers who share honest feedback builds trust and encourages them to continue providing feedback. Satisfied customers are more likely to return and recommend the company to others.
What to avoid in the prioritization process:
Positive feedback reinforces desired behaviors and solutions—it’s worth analyzing it alongside negative feedback to understand what works. 53% of customers cancel a service after a bad experience, so each of the above mistakes has a huge impact on the company’s results.
With thousands of comments per year, manual analysis is ineffective. A customer experience and Voice of the Customer (VoC) platform streamlines feedback management, serving as the “central nervous system” for the voice of the customer. VoC tools help set priorities based on the number of reports, sentiment, and impact.
Practical benefits:
Solutions like YourCX facilitate the transition from data to decisions. They help develop the team’s data analysis skills, but the platform itself cannot replace process maturity and a customer-centric culture within a large organization or the CX team’s work environment. Regular feedback from the platform enables the team to work based on data, not intuition—and this is what distinguishes mature VoC programs from nascent ones, even in large companies and workplaces where change management requires mutual respect and understanding between teams.
The table below can serve as a checklist for workshops with business teams:
Criterion | Guiding Question | Example of a signal | Impact on priority | Recommended response |
|---|---|---|---|---|
Problem scale | How many customers have been affected in the last 30 days? | 40% increase in payment-related comments in Q3 | High, if the trend is rising | Root cause analysis, change initiative |
Impact on the customer | Does it cause frustration or a loss of trust? | Phrases like “never again,” “last time” | High when emotions are running high | Strategic priority |
Business impact | Does it affect conversion, churn, or costs? | 5% drop in checkout completion rate | Very high | Quick win or IT project |
Customer segment | Does this affect high-value or new customers? | Problem visible only in B2B with MRR >10k | High for high-value segments | Dedicated segment analysis |
Journey stage | Does this apply to the moment of truth? | Errors during the payment or onboarding stage | High at critical stages | Immediate intervention |
Cost of the solution | Is a content change sufficient, or does it require IT? | Changing the message vs. system redesign | Low cost = quick win | Quick win in communication |
Risk of inaction | What about monthly or quarterly? | Rising churn, regulatory risk | High in the event of escalation | Monitoring the roadmap |
Below are three hypothetical issues rated on a scale of 1–5 (5 = highest impact / easiest to solve):
Dimension | P1: Unclear delivery costs | P2: Long support response times | P3: The newsletter is hard to read |
|---|---|---|---|
Frequency | 4 | 3 | 4 |
Negative sentiment | 5 | 4 | 2 |
Impact on NPS/CSAT/CES | 5 | 4 | 2 |
Business Impact | 5 | 4 | 1 |
Segment Importance | 4 | 3 | 2 |
Cost of the solution (ease) | 4 | 2 | 4 |
Total | 27 | 20 | 15 |
P1 has the highest score—high impact and low solution cost. P2 has a high impact on CES and costs, but a higher solution cost (recruitment, automation). P3—despite frequent comments—has a low level of business impact and is a candidate for medium priority. This comparison helps demonstrate to management why not all “popular” issues are the top CX priority. How does effective feedback management differ from reactive firefighting? It’s precisely the ability to score issues and provide feedback to teams regarding expectations for future actions.
Questions to ask for each CX issue. Issues for which the majority of answers are “yes” should be at the top of the list for the upcoming quarter:
73% of customers say that their experience influences their purchasing decisions. Every “yes” on the list above is a sign that constructive feedback cannot be ignored. The post’s navigation allows you to return to the section with the matrix or scoring to apply these tools to specific scenarios in the personal and professional lives of the CX team.
Below are the most common questions about prioritizing customer feedback and managing the customer experience.
At least once a quarter, with additional ad hoc reviews during new implementations, seasonal events (e.g., Black Friday), or crises. In e-commerce and SaaS—even monthly, if the volume of feedback is very high. The “sandwich method”—combining positive observations with issues—also works well as a way to communicate during review meetings.
A CX or Voice of Customer (VoC) specialist or team is responsible for the process, but decisions should be made jointly with representatives from product, customer service, sales, operations, and marketing. A sponsor on the executive board plays a key role in ensuring that CX priorities translate into budgets, commitment, and solutions. The FUKO method, the SBI method, and the FUKO model are tools that help employees provide constructive feedback within the organization. Among the best-known methods for providing feedback in the workplace, it’s also worth mentioning the “next time” approach, which focuses on future actions. The question of who is responsible should not be left unanswered—understanding roles and decision-making skills is important both in personal life and in the workplace.
It isn’t necessary to start with. A simple tagging and scoring model can be implemented manually. AI (natural language processing, automatic tagging, sentiment analysis) significantly speeds up work at scale, but it cannot replace business decisions and an understanding of context. It’s worth providing feedback to AI tools by calibrating the models based on manual reviews of sample comments.
Combine automated methods (topic clustering, sentiment analysis in a CX tool) with periodic, manual in-depth reviews—where the team reads a sample of comments. It’s a good idea to limit the length of open-ended questions and ask them at specific points in the customer journey, rather than “everywhere.” Honest feedback from customers is more valuable than a large number of short, generic responses.
Feedback is raw input: a single comment or rating. A CX insight is a generalized observation drawn from multiple signals, with an understanding of cause and effect. An insight always leads to a recommendation for action; feedback alone does not. In practice, this means that both positive and negative feedback are raw material—only the analysis of multiple signals yields an insight that can be used to plan improvements.
An excess of feedback doesn’t have to mean chaos—if a company has consistent categories for CX issues, a process for moving from comments to insights, a prioritization matrix, a simple scoring system, and clear owners of actions with regular reviews of priorities.
Prioritizing CX issues isn’t about responding to everything. It’s about responding to what truly changes the customer experience and the company’s bottom line. CX leaders have achieved more than twice the revenue growth of companies lagging behind in this area —the results speak for themselves.
Start with a customer journey map, a few consistent categories, a simple scoring model (1–5), and monthly review sessions involving representatives from CX, product, and customer service. Only after prioritizing CX should you scale your Voice of the Customer program, automate analysis, and develop more advanced models—that’s when every piece of new feedback truly drives business decisions.
Copyright © 2023. YourCX. All rights reserved — Design by Proformat
