

- Research platform
Sources of information
Data analysis
Actions

- Solutions
For whom
Problems / Issues

- Materials
Materials
- About us
About us
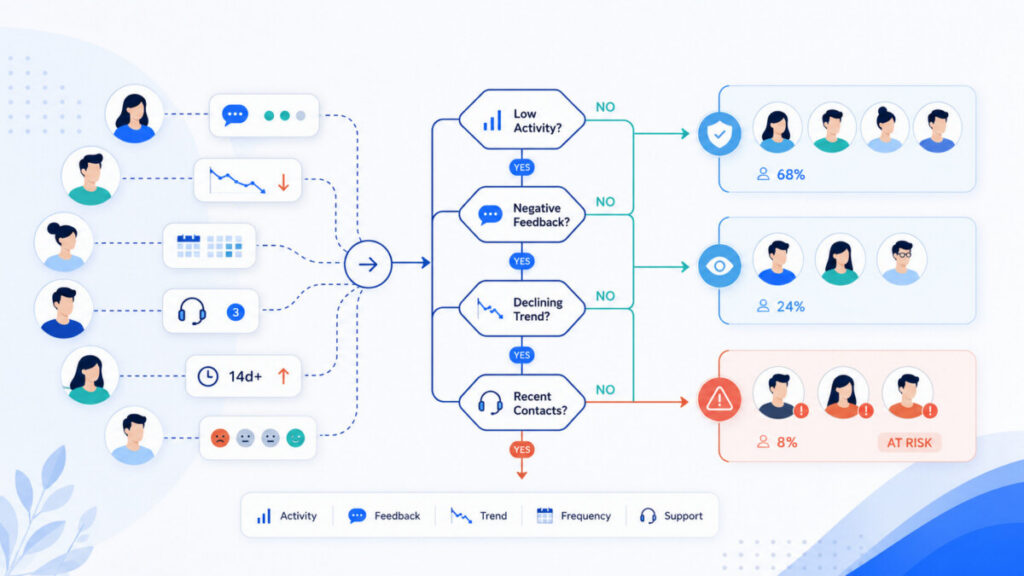
At-risk customers don’t always say outright that they want to leave. More often, they leave clues in their ratings, comments, activity, complaints, and contact history.

Many companies put off addressing churn because they associate it with machine learning, big data, model training, and AI implementation. This is understandable, but often unnecessary at the outset.
Customers at risk of churning send early warning signals: they lower their NPS score, report difficult interactions with customer service, stop logging into the dashboard, buy less frequently, or leave comments like “this is my last purchase.”
Churn prediction without AI should be treated as an early warning system, not as an infallible forecast. The goal is to make decisions based on data that’s already available.
Advanced use of AI has enormous potential, but it is not a prerequisite. First, it’s worth organizing customer data, response processes, and team responsibilities.
At-risk customers are individuals or companies for whom the likelihood of canceling, reducing purchases, not renewing a subscription, or switching to a competitor is increasing.
It’s worth distinguishing between four situations:
Not every dissatisfied customer will leave. Conversely, many customers at risk of leaving do not openly voice their concerns. That is why it is particularly important to cross-reference these signals.
Example: A single low CSAT score after delivery in e-commerce may indicate temporary frustration. But a low CSAT score, a decline in purchase frequency, and a lack of email opens signal a drop in engagement with subscription services and a higher risk of churn.
Customer churn rarely results from a single incident. Most often, it is the result of accumulated friction points along the customer journey.
The most common causes are:
Price is often the last straw. If a customer has previously felt neglected, lacked information, or encountered issues with the process, the competition simply makes the decision to switch easier.
Warning signs can be divided into four groups.
Survey signals: low NPS, a decline in NPS over time, low CSAT after a complaint, high CES, negative comments after contacting support, and a lack of response to a survey from a customer who previously responded regularly. NPS satisfaction metrics allow you to monitor customer engagement, and NPS and CSAT surveys can detect issues with customer satisfaction.
Behavioral signals: A decline in customer activity may signal churn. A decrease in purchase frequency increases the risk of customer churn. A 50% reduction in order volume may indicate a desire to leave. A sudden drop in the “Recency” metric signals a possible customer churn. RFM analysis categorizes customers based on recency, frequency, and monetary value.
Operational signals: a high number of support tickets, recurring complaints, escalations, low first-contact resolution rates, and late payments. Monitoring the frequency of support tickets helps detect a decline in engagement. An increase in the number of customer service requests may suggest engagement issues.
Qualitative signals: comments such as “I’m canceling,” “this is the last time,” “never again,” “I’m looking for an alternative,” public ratings of 1/5, and recurring themes: price, delivery, errors, lack of communication, and complaints.
NPS, CSAT, and CES are essential tools for identifying customers at risk of churn without AI tools.
In NPS, detractors require the most attention, but the trend is often more important than a single rating. A drop from 9 to 6 can be a stronger signal than a consistent score of 6. NPS benchmarks vary significantly by industry, so it’s important to compare your results carefully—for example, using industry data from RethinkCX.
CSAT works well after specific events: delivery, a complaint, contact with customer service, or onboarding. A low CSAT score following a critical moment should trigger a recovery process.
CES reflects the effort required. If a customer had to contact the company three times about the same issue, the risk increases. CX research often indicates that high effort is a strong predictor of churn; Searchlab describes similar observations.
In their feedback, customers often mention what might lead them to churn. Natural language processing or generative AI isn’t always necessary.
A simple analysis of customer comments is sufficient:
Example tags: “complaint,” “lack of contact,” “technical issue,” “price,” “delivery,” “product quality,” “cumbersome process,” “competition,” “cancellation.”
According to Enterpret’s analysis, qualitative feedback can sometimes be visible earlier than drops in activity—even by several weeks (Enterpret).
The same signal can mean different things across different segments. A low CSAT score after a new SaaS customer’s first login indicates an onboarding issue. A low CSAT score following another complaint from a 5-year customer suggests a potential loss of customer trust.
Segment by:
A CX platform can combine segments, survey data, transactions, and contact history without a complex data warehouse.

A customer health score is a synthetic indicator of the health of a relationship. It can be built using simple rules, without models or AI systems.
Example risk scoring:
Predictive models analyze signals such as a declining purchase frequency, but simple scoring also helps. Historical data from the last 6–12 months allows you to identify which signals most often preceded churn.
A simple classification might look like this:
In e-commerce, purchases, complaints, and reviews are more important. In SaaS—logins, onboarding, feature usage, and renewals. In B2B—escalations, relationships with decision-makers, late payments, and lack of contact.
The thresholds don’t have to be perfect. They’re meant to create a useful action plan.
The matrix combines two axes:
High value and high risk have the highest priority. Second priority: high value and medium risk. Third: low value and high risk, if the problem is widespread.
This isn’t about ignoring smaller customers. It’s about managing profitability and making sensible use of customer success, marketing, and sales resources.
Detecting risk is just the beginning. An alert without an owner is just a report.
Alerts may include:
Actions: phone call within 24 hours, email with instructions, priority support, escalation to the process owner, compensation, personalized win-back offers. Identifying churn risk enables proactive marketing efforts and can increase sales without aggressive acquisition.
A closed feedback loop looks like this:
Example: An NPS detractor reports an unresolved complaint. Customer Success contacts the customer within 24 hours, clarifies the issue, initiates corrective actions, and checks CSAT after 7–14 days.
If the same problem occurs with many customers, it’s not enough to resolve individual cases. The process must be improved.

Signal type | Example | Possible interpretation | Recommended response | Priority |
|---|---|---|---|---|
NPS | Rating 0–6 | Detractor, potential churn | Contact within 24 hours, analyze the comment | High |
CSAT | Decrease after customer service | Issue with the support process | Callback, escalation | Medium/High |
CES | High effort required after a complaint | Friction and frustration | Process explanation, step-by-step assistance | High |
Complaints | 2 in 30 days | Recurring problem | Process owner, root cause solution | High |
Activity | No login for 30 days | Decline in engagement | Onboarding contact | Medium |
E-commerce | Abandoned carts | Hesitation or decision-making problem | Reminder, analysis of obstacles | Medium |
Comment | “I’m canceling” | Direct signal of departure | Phone call, priority service | Critical |
Public opinion | Rating 1/5 | Risk of losing relationships and reputation | Public response Private contact | High |
Support | Long resolution time | Low operational effectiveness | SLA review, escalation | Medium/High |
Priority depends on the segment, customer value, and scale of the problem.
Measure not only the number of alerts, but also the impact of actions:
If possible, conduct A/B testing. Some high-risk customers receive a targeted outreach, while others receive a standard follow-up. This allows you to assess the impact of the actions themselves, rather than just the team’s activity.
Rules are a good starting point, but they may not be sufficient at large scale. AI identifies customers at risk of churn based on their behavior. AI identifies customers at risk of churn based on data analysis. AI analyzes customer data in real time, and AI algorithms predict customer needs based on their behavior.
AI can analyze negative reviews as a signal of customer churn risk. AI analyzes purchase history to predict future customer needs. AI analyzes customer data to predict their future needs. AI creates dynamic customer profiles based on their interactions.
In the context of AI, it’s worth noting that artificial intelligence automates the personalization of offers for customers. AI personalizes offers based on real-time customer behavior. 1:1 personalization treats each customer as a separate segment, and dynamic product recommendations are unique to each customer. AI recommendation systems increase the average cart value by 15%, and dynamic product recommendations increase the average order value.
AI automates customer service through intelligent 24/7 chatbots. AI forecasts demand, optimizing inventory levels. Real-time price automation maximizes margins. Intelligent systems and language models can reduce operating costs, but the use of AI solutions carries certain risks.
The GDPR requires the protection of customers’ personal data. The GDPR still applies in the context of AI. AI may increase the risk of personal data breaches, and AI may infringe on personal data privacy. Customers want control over their data. User consent to data processing must be informed and understandable, and user consent to data processing must be informed. Transparency in data use builds customer trust.
Data security, data protection, privacy protection, data encryption, and regular data protection audits are essential for GDPR compliance. Data encryption is crucial for data protection. Regular data protection audits are essential for GDPR compliance.
With vast amounts of sensitive data, it is also necessary to consider security measures, access controls, network traffic, malware, and procedures in the event of a data breach. Confidential data, source code, or documents should not be stored in external tools without consent. The secure use of AI is absolutely essential.
The most common mistakes are:
For many companies, this means a loss of time, money, and customer trust.
A CX platform supports comprehensive feedback management: collecting NPS, CSAT, and CES scores; analyzing comments; tagging topics; sentiment analysis; customer segmentation; and CX dashboards and alerts.
YourCX can help consolidate survey data, transaction data, contact history, and action statuses in one place. This makes it easier to identify at-risk customers without building your own analytical tools.
Look for tools that support business goals, security, regulatory compliance, employee engagement, and rapid report generation. For CX teams, this automation provides a competitive advantage by reducing the time from signal to response.
Meta title: How to Identify At-Risk Customers Without Advanced AI? | YourCX
Meta description: A practical guide to detecting at-risk customers based on NPS, CSAT, CES, activity, and complaints.
URL slug: how-to-identify-at-risk-customers-without-ai
Internal linking suggestions:
Sample anchors: customer satisfaction analysis, Voice of Customer program, real-time NPS surveys, closed-loop feedback, customer retention in e-commerce.
Yes. The goal of a system without AI is early warning, not perfect forecasting. A combination of surveys, behavior, complaints, contact history, and comments is sufficient.
A simple scoring system—for example, a low NPS, a decline in activity, or a complaint—can help identify customers worth proactively reaching out to.
The minimum is one satisfaction metric, such as NPS or CSAT, data on purchases or activity, a history of interactions with customer service, and comments or notes from conversations.
In a small online store, this data usually already exists. You just need to combine it into a single customer view.
Not always. It’s best to reserve personalized outreach for high-value customers, strategic segments, and critical situations.
For the rest, automated follow-ups and trend analysis work well. If a problem occurs on a large scale, improving the process is more important than offering individual compensation.
It’s a good idea to update the high-risk list at least once a week, and in SaaS, even daily. It’s a good idea to review the scoring rules every 3–6 months.
Compare the scoring results with actual churn. Over time, this helps the system better identify what customers need and which signals truly predict churn.
When the customer base is very large, the data is scattered, the relationships are difficult to interpret manually, and the company needs forecasts well in advance.
In the field of artificial intelligence, data maturity is more important than trends. First, clarify your definitions of churn, segments, consent, processes, and a closed-loop feedback system.
At-risk customers can be identified without advanced AI. The greatest value comes from combining simple signals: NPS, CSAT, CES, comments, complaints, activity, purchase history, and segmentation.
The key isn’t the data analysis itself, but a quick response: an alert, an owner, an action, and a follow-up to check the results. Only such a system builds customer loyalty and reduces churn.
Start with a few rules, a single high-risk list, and the checklist from this article. As the process matures, implementing AI solutions will become easier, safer, and more cost-effective.
Copyright © 2023. YourCX. All rights reserved — Design by Proformat
