

- Research platform
Sources of information
Data analysis
Actions

- Solutions
For whom
Problems / Issues

- Materials
Materials
- About us
About us
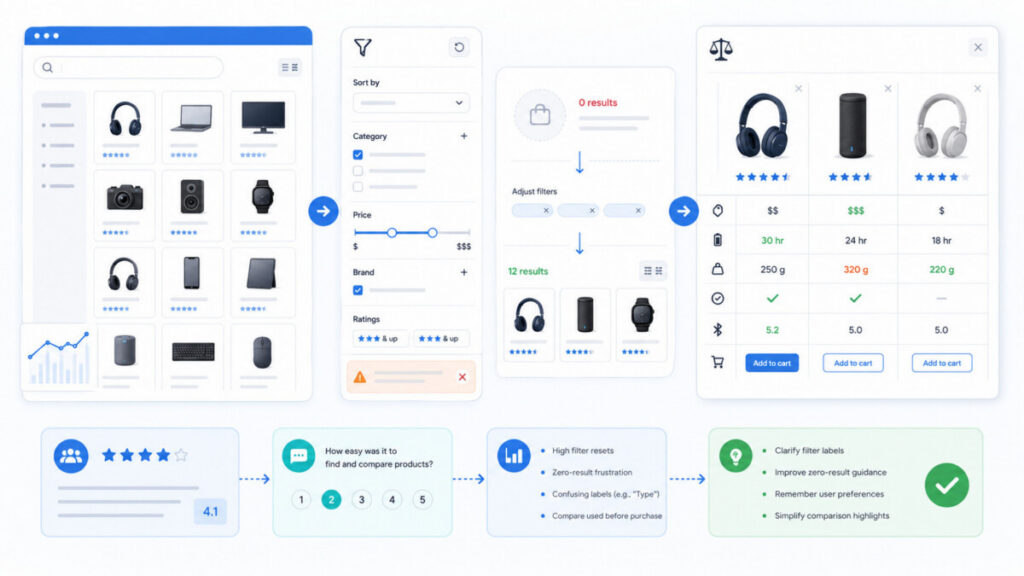
Filters and product comparison tools are one of the most underrated stages of the e-commerce purchase funnel. When a customer visits a store’s website and tries to narrow down a catalog of 30,000 SKUs to three or four products that meet their expectations, the quality of the filters determines whether they’ll complete the purchase or go back to Google. This article shows you how to research the experience of customers using comparison tools and filters—step by step, with specific metrics, research questions, and examples of implementations on the YourCX platform.
The points below summarize the entire article. If you manage an e-commerce business and are short on time, start with these—each is expanded upon later in the text.

Filters and comparison tools are located at a key stage of the customer journey—between landing on a category page or search results page and clicking on a specific product. When a customer navigates a store with a catalog of tens of thousands of products, it is filters and sorting that determine whether they’ll find the right product in a matter of seconds or leave the site frustrated after a few minutes of fruitless browsing. Filters play a crucial role in the purchasing process—they’re a tool that reduces the paradox of choice.
Take an electronics and home appliances store with 40,000 products. A customer looking for a TV must filter by screen size, technology (OLED, QLED, LED), resolution, price range, and brand. Without well-designed filters, they’ll have to browse through hundreds of irrelevant items. In a fashion marketplace with hundreds of thousands of color and size variations, the problem is even more acute—the customer needs to immediately narrow down the selection to “size M, color black, oversized style.” The relevance of filtering criteria should correspond to customers’ actual needs, not the structure of the store’s database.
The speed and accuracy of results after applying filters are crucial to the purchasing process. Well-designed sorting options—such as “top-rated,” “most popular,” and “best value”—complement filters by shortening decision-making time. According to research by the Baymard Institute, as many as 76% of large e-commerce sites have serious issues with filters, which lead to session abandonment. In practice, this means that intuitive filtering reduces customer effort, improves the customer effort score, and directly translates to a higher conversion rate.
Research confirms that in 2023, 48% of consumers considered service more important than price, and customers who experience high-quality CX are 2–3 times more likely to make repeat purchases. Filters and comparison sites represent the “moment of truth” in customer journey analysis—the customer either finds a product that meets their expectations or returns to a price comparison site (Ceneo, Skąpiec) or a competitor. A positive customer experience at this stage has a direct impact on the customer lifecycle and future purchasing decisions.
UX/CX errors in filters are difficult to detect using quantitative data alone, because web analytics will show an increase in abandonment rates but won’t reveal that the cause is an unclear filter name or a lack of results after narrowing down the criteria. Below are key areas that require attention:
Filters and comparison tools are a part of the overall customer journey that is too often researched only during major redesigns. Yet it is precisely here that key decision-making touchpoints are concentrated—and this is where a systematic approach to measuring customer experience should be applied. Customer journey analysis should identify “search and filtering” as a separate stage with assigned CX metrics: customer satisfaction score, customer effort score, abandonment rates, and time to find a product.
Combining quantitative data (web analytics, clickstream, heatmaps) with qualitative data (VoC comments, usability tests, in-depth interviews) allows us to build a complete picture of customer behavior on product list screens. Research should be conducted on an ongoing basis—not just during redesigns—to capture the impact of seasonality (Black Friday, holiday sales) on customer behavior within filters. This is the responsibility of the entire organization: from the UX team, through analysts, to management.
Web analytics analysis examines metrics such as bounce rate, CTR from the product list, filter reset frequency, and the percentage of sessions that do not proceed to a product card. This data tells us WHAT the user does—but it doesn’t tell us WHY. Customer experience research uses both quantitative and qualitative methods, and only by combining them can we get the full picture.
Example: A shoe store notices a high bounce rate in GA4 from the product list after users apply the filters “size 42” and “natural leather.” Without customer feedback, one might mistakenly assume that the problem is the price. However, VoC comments reveal that the “natural leather” filter returns products with synthetic inserts—customers perceive this as misleading. Another example: an electronics store is seeing cart abandonment after users apply the screen size filter—users don’t understand whether the slider displays inches or centimeters.
Usability testing involves observing users as they perform tasks—even 5–8 sessions can reveal the main UX pain points. Eye tracking allows you to see which filters are most visible to users, and card sorting helps you understand how customers mentally categorize the product range (e.g., “laptops for working from home” instead of “business laptops”). In-depth interviews allow us to understand customers’ needs regarding filters at a deeper level than short surveys. All of these qualitative studies provide insights that cannot be derived from analytical tools alone. In customer experience management, combining VoC with analytics (e.g., in YourCX) makes it possible to link responses to a specific session, filter configuration, and customer segment—which allows for the precise identification of patterns and the resolution of problems at their source.
Online surveys are short studies on user experiences that appear in the context of a specific screen—for example, after using filters, when attempting to leave the page, or after a prolonged period of inactivity on a product list. They should contain no more than 2–4 questions to avoid irritating users and causing survey fatigue.
Examples of survey questions for screens with filters:
Satisfaction surveys measure satisfaction after using a comparison site or the filtering process. CSAT measures customer satisfaction on a scale of 1 to 5, while NPS measures customer loyalty based on their recommendations. The survey methodology combines hybrid methods to obtain reliable results—which is why it’s worth using both scaled questions (CES, customer satisfaction score) and open-ended questions.
Exit-intent surveys consist of questions asked when a user attempts to leave the product list: “What is the main reason you are not continuing with your purchase?” with options such as:
Surveys can be targeted: displayed only to new users, on mobile devices, or in sessions where at least one filter has been applied. This approach distinguishes professional CX research from mass satisfaction surveys. A/B testing involves comparing two versions of a product comparison tool or filter layout—and it’s worth combining this with simultaneous measurement of customer satisfaction for each variant. Thanks to platforms like YourCX, the results of in-page surveys can be linked to behavioral data (click path, time spent on the list, device type), which allows for a precise diagnosis of what needs improvement.
YourCX is a Polish customer experience research platform that specializes in contextual analysis of the customer journey in e-commerce—including screens with product lists, filters, and comparison tools. Implementation involves embedding a simple JavaScript snippet on the website, which requires minimal IT effort and allows the platform to operate alongside existing analytics tools (GA4, CRM systems, e-commerce platforms). Customer satisfaction surveys focus on the user experience and the effectiveness of purchasing processes, both online and across various devices.

YourCX enables you to measure satisfaction, the Customer Effort Score, and gather customer feedback precisely when filters are being used—for example, after clicking “Apply Filters,” after using the “Compare Products” feature, or when returning from the comparison page to the list. The platform allows you to configure rules for displaying surveys in real time: for example, only to users who have applied at least two filters, spent more than 90 seconds on the list, seen the “No results” message, or shown signs of frustration (resetting filters, no clicks). This ensures high-quality qualitative data and minimizes user frustration.
Specific research questions that can be implemented:
Question | Type | What it measures |
|---|---|---|
“Was it easy for you to find the product you were looking for?” | 1–7 scale (CES) | Customer Effort |
“How satisfied are you with the filtering and sorting options?” | Scale 1–5 (CSAT) | Satisfaction |
“What was missing from our filters?” | Open-ended question | Functional shortcomings |
“Were the filter names easy to understand?” | Scale Suggestion | Clarity of naming |
“Did comparing the products help you make a decision?” | Scale 1–5 | Comparison tool usability |
YourCX reports combine CX metrics (CES, CSAT, NPS) with business data: conversion rate from the product list to the product card, percentage of sessions using filters, and the impact of filter satisfaction on customer lifetime value. A high NPS indicates strong customer loyalty and helps predict future behavior. Reports can be filtered by product categories, device types (desktop, mobile), and customer segments (new vs. returning)—allowing you to combine data from various sources to get a complete picture.
Optimization scenario from 2025: A YourCX client running an electronics store noticed that users applying the “55–65-inch diagonal” filter had an average CES 0.5 points lower than others. Reason: The slider range was too broad; there were no predefined subranges (55–60, 60–65). After implementing the recommendations—clearer descriptions, division into subranges, and the addition of tooltips—there was a double-digit percentage increase in conversions from the list to the product card. According to CES benchmarks for e-commerce, the average CES in retail is 5.6–6.0 on a 7-point scale, and the top quartile reaches ≥ 6.2—every improvement of 0.3–0.5 points translates into a measurable increase in conversion.
82% of customers who received excellent service made a repeat purchase. 71% of B2C customers expect personalized interactions, and personalization increases customer loyalty by 25–95%. In the context of filters, personalizing communication can mean adaptive filters (e.g., remembering a returning customer’s preferences, suggesting filters based on browsing history). 60% of customers take advantage of personalized offers more often, and personalizing the experience increases the average order value. Increasing the value of a product for the customer starts with making it easier for them to find what they’re looking for. Artificial intelligence supports this process through automatic tagging of open-ended responses, sentiment analysis, and the identification of frustration patterns in VoC data.
Optimizing filters and comparison tools based on CX data—customer reviews, customer effort score, and customer satisfaction score—is one of the fastest ways to improve conversion rates without requiring significant investments in traffic or marketing efforts. Filters are a critical stage in the customer journey; neglecting them leads to high effort, abandonment, and negative experiences that immediately impact financial results. Data from Opensend shows that over 60% of customers abandon a brand after high-effort experiences, and improving the CES can increase retention by 12% or more.
Positive experiences built during the filtering stage influence the entire cycle—from after-sales service to loyalty programs. 88% of customers trust recommendations from friends more than other channels, including social media ads—which means that satisfied customers become ambassadors for your brand. Building lasting relationships with customers starts with a positive experience at every stage, including in-store and at every touchpoint. Customers are 2–3 times more likely to make repeat purchases after a good experience—this is the foundation for acquiring new customers through recommendations, not just paid campaigns.
Call to Action: Contact the YourCX team for a free CX audit consultation for your product lists and filters. We’ll propose a pilot Voice of Customer program for a selected category (e.g., electronics, fashion, home and garden)—it takes just a few days to launch, and all you need is a simple tracking code. Within 30 days, you’ll receive valuable insights that will allow you to make decisions based on data, not guesswork. Building trust between your company and your customers starts with understanding their needs and expectations—and YourCX provides the key tools to do so, complementing your existing analytics with real-time customer feedback.

Below are answers to the most common organizational and technical questions regarding customer experience research in the area of filters and comparison tools—aspects that were not fully covered in the main body of the article.
Best practice is continuous tracking with a low survey display rate—for example, 5–10% of sessions that meet the trigger criteria. This allows you to collect data consistently without annoying the majority of users. The minimum is quarterly tracking combined with an analysis of seasonality (sale periods, Black Friday, the holiday season). Customers who have had a positive experience generate higher profits, so it’s worth monitoring how seasonal changes in product assortment or promotions affect customer behavior in filters. Consistency also allows you to predict future behavior and respond proactively before drops in conversion rates become visible in transactional data.
For general insights into filters in a large e-commerce store, 300–500 response sets per month are often sufficient. For analysis at the level of a specific category (e.g., “4K TVs” or “athletic shoes”), it’s worth aiming for a minimum of 100–150 responses to achieve statistical significance. YourCX helps assess whether the collected sample is sufficient and suggests when a client has generated enough data to discuss specific changes. Each response is a touchpoint that provides insight into customer needs—even small samples of qualitative data reveal recurring patterns.
Yes—and it’s definitely worth it. A/B tests involve comparing two versions of a comparison tool or filter layout, but they only measure the difference in conversion rates. By combining them with satisfaction and CES measurements for each version (using YourCX), you can evaluate not only the conversion rate (CR) but also the subjective customer experience. YourCX can track traffic from a specific A/B test version, allowing you to analyze whether the increase in conversion rate goes hand in hand with a better experience—or whether the “winning” variant in terms of conversion rate causes frustration in another segment. Customers who experienced excellent customer service were 82% more likely to make a repeat purchase—which is why CX requires a holistic approach, not just the optimization of a single metric related to the brand or product.
The integration relies on session or user IDs, which allow you to link CX data with on-site behavior. YourCX allows you to export data to CSV or via API, enabling you to create segments of users with low CES in GA4 filters and track their subsequent behavior throughout the funnel. Data from various channels (web, mobile app) and analytics tools can be consolidated into a single dashboard. The integration allows you to track the impact of experiences on later stages of the funnel—from clicking a filter to completing a purchase—and link this to key touchpoints such as post-sale support, phone calls with support, or interactions on social media—providing a comprehensive map of touchpoints. This insight forms the foundation for a competitive advantage and helps build the company’s image as a brand that prioritizes the customer experience.
Start with a simple plan:
Such a pilot doesn’t require a large investment and delivers quick wins that help convince management to expand the VoC program to the entire store. 78% of customers will buy again if their online experience was excellent—and every problem solved thanks to the Voice of the Customer brings the store closer to that goal. Personalizing communication and tailoring filters to their needs is an investment that pays off quickly and is key to building lasting relationships with customers at various touchpoints with your brand.
Copyright © 2023. YourCX. All rights reserved — Design by Proformat
