- Research platform
Sources of information
Data analysis
Actions
- Solutions
For whom
Problems / Issues
- Materials
Materials
- About us
About us
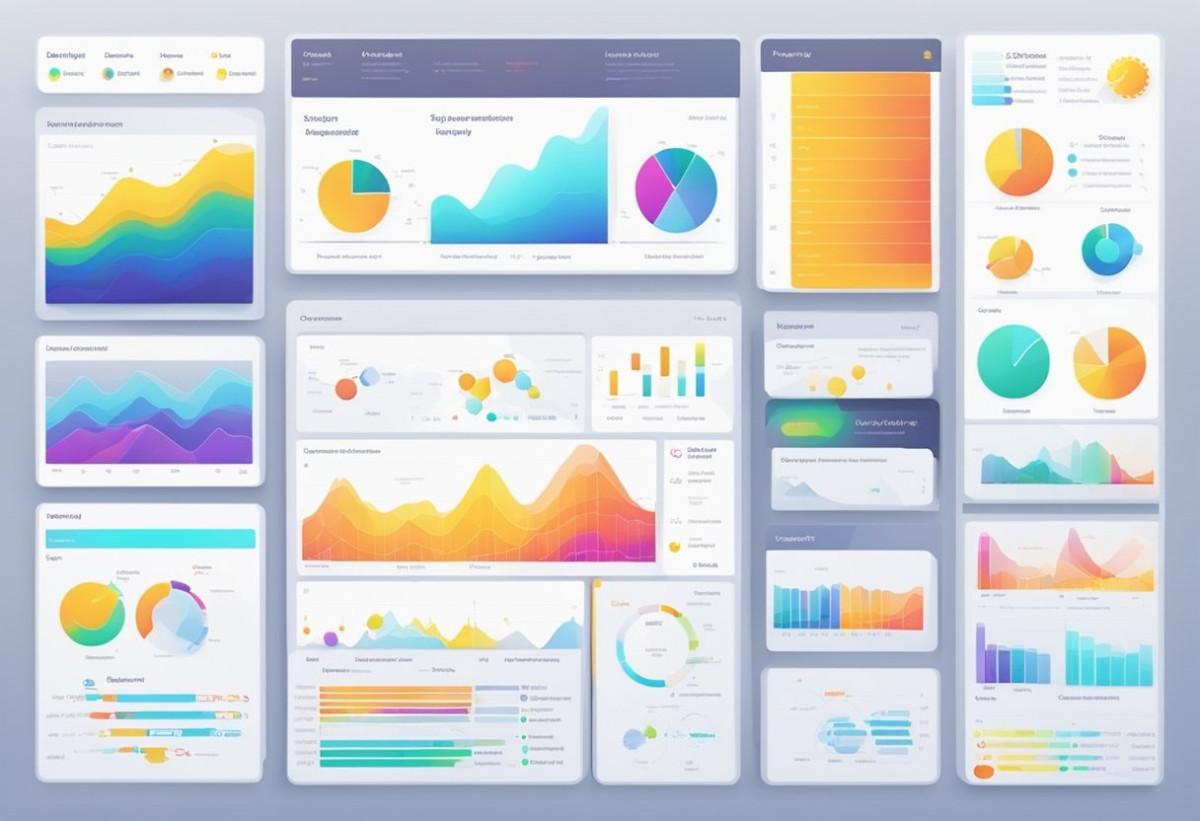
Optimising advertising campaigns is crucial in the fast-paced digital landscape. Using tools like visual questions and heatmaps can significantly enhance campaign performance by providing insights into user behaviour and engagement. Also testing and optimizing site and mobile apps mockups can significantly speed up design proces.
In today's digital world, the importance of testing mockups and advertising concepts cannot be overstated. Effective testing helps identify potential flaws before full-scale deployment. It allows businesses to understand how users will interact with ads or interfaces and ensures that the message is clear and engaging. Testing also provides an opportunity to tweak designs and content to maximise their impact, ultimately leading to higher conversion rates and better ROI. By refining ads based on real user interaction, businesses can create more effective campaigns that resonate with their audience.
Visual questions and heatmaps are essential tools for optimising advertising campaigns. Visual questions involve asking users questions that help gauge their reactions to various ad elements and understand user behavior. This method provides qualitative insights into user preferences and behaviours. Heatmaps are used for visualizing data and understanding user behavior by showing where users focus their attention on a webpage or ad. Colours indicate the intensity of attention, with warmer colours showing more focus. By combining these tools, businesses can obtain a comprehensive understanding of user interactions, enabling them to fine-tune their campaigns for maximum effectiveness.
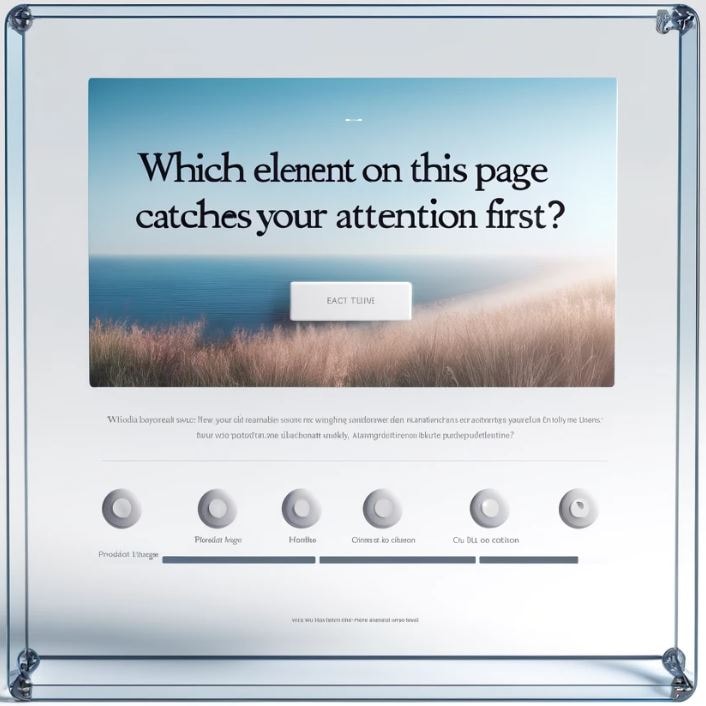
Visual questions are an effective method used in advertising and interface design to gather feedback on design elements and user interactions. These questions help identify potential issues and areas for improvement.
Visual questions involve asking users to interact with visual content, such as images, advertisements, or user interfaces. Participants are shown visual elements and asked specific questions about them. This method provides insights into how users perceive and interact with the visual components.
For example, users might be asked to click on areas they find most appealing. Others might include rating the clarity of a visual message. The user may also be asked to click on an item that they believe will enable them to complete the task. Through this interaction, researcher gather valuable data directly related to user experience and preferences.
Examples of visual questions help illustrate their practical applications. In a mockup of a webpage, users might be asked, "Which area of the page catches your attention first?” or "Where would you click if you wanted to get information about X?".
Another example involves an ad campaign where users are asked to click on elements they find confusing.
These questions make it easy to collect feedback on specific visual elements, like logos or taglines. Advertisers then use this data to refine their designs based on actual user responses.
Using visual questions offers numerous benefits. Foremost, they provide direct feedback from users, helping to identify areas that need improvement. This can lead to better design decisions that more accurately reflect user preferences.
Additionally, visual questions can make user testing more engaging, leading to more candid and useful responses. The data collected allows advertisers to refine their messages and visuals to be more effective.
Finally, integrating visual questions into the testing phase can save time and resources by identifying potential design flaws early in the process. The insights gained are practical and ensure that the final product aligns closely with user expectations and needs. This approach also leads to enhanced user engagement by utilizing heatmaps and click tracking data to optimize the user experience and drive conversions.
Definition: Click maps questions involve presenting users with a visual interface (e.g., a webpage, mockup, or prototype) and asking them to click on specific areas or elements in response to a question. The clicks are then recorded and analyzed to create a visual representation (heat map) of user interactions.
Click maps questions are user feedback tools used to gather insights on how users interact with different elements of a webpage. They present users with a visual interface and ask them to click on specific areas or elements in response to a question. The clicks are recorded and analyzed to create a visual representation (click map) of user interactions.
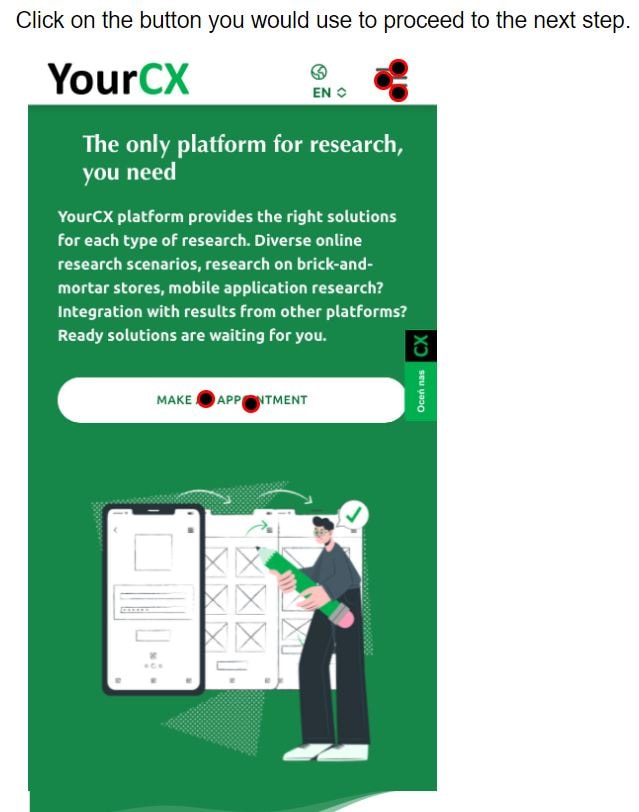
"Click on the element that catches your attention first."
"Click on the area where you would expect to find more information."
"Click on the button you would use to proceed to the next step."
Visual Data Representation: Click maps visually represent where users click, showing popular and overlooked areas using heatmap-style graphics.
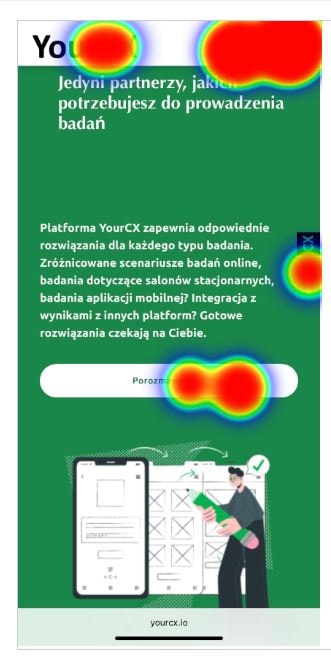
User Interaction Insights: They help determine which elements of a page are engaging or confusing, aiding in understanding user behavior and preferences.
Improving User Experience: Highlight usability issues and areas for improvement by identifying elements that users mistakenly believe are clickable.
Optimizing Page Layout: Help optimize page layout by showing which elements should be more prominently placed, leading to better conversion rates.
Data-Driven Decisions: Provide quantitative data for making informed decisions about design changes, content placement, and website optimization.
Using click maps questions effectively can enhance user engagement and overall user experience by providing valuable insights into user interactions with mockups and advertising concepts.
In the competitive landscape of marketing, optimizing advertising campaigns using visual questions and heatmaps can provide significant insights into user behavior and preferences. By combining these tools with traditional survey questions, businesses can gain a comprehensive understanding of user interactions, enhancing user engagement and optimizing website content for better conversion rates. Here are the key business benefits of this integrated approach:
Visual questions and heatmaps offer a detailed visual representation of how users interact with a web page, showing where they click. However, these tools alone do not explain why users behave in certain ways. By incorporating traditional survey questions, businesses can gather qualitative data to understand user behavior more deeply. This combined data helps in identifying patterns and user preferences, providing a comprehensive understanding of user segments and their expectations.
Heatmaps and clickmaps visually depict areas of high and low engagement on an imige or website, but they lack context. Heatmaps can be used to optimize landing pages by highlighting areas for improvement. Traditional survey questions add this missing context by directly asking users about their experiences and perceptions. For example, if heatmap data shows that users ignore a specific design element, survey questions can reveal whether this is due to confusion, disinterest, or another reason. This contextual information is crucial for making data-driven optimizations and targeted improvements to enhance user experience, including optimizing page layout based on user behavior insights.
Heatmaps can highlight friction points and areas of interest, but they cannot confirm the reasons behind these user interactions. Traditional survey questions validate hypotheses generated from visual data, ensuring that design changes are based on accurate insights rather than assumptions. For instance, if a heatmap tool indicates high user activity around a non-interactive image, a survey can confirm if users expect it to be clickable. This validation process ensures that marketing strategies and website optimization efforts are grounded in actual user feedback.
Surveys allow businesses to collect direct feedback on user preferences, complementing the indirect insights from visual questions and heatmaps. For example, if scroll maps show that users stop reading at a certain point, survey questions can uncover the reasons behind this behavior. Understanding specific user segments' preferences helps in optimizing content placement and tailoring marketing campaigns to better meet user expectations.
Combining visual data with survey responses enables a user-centered design approach. Click and scroll heatmaps provide insights into user engagement and the visibility of important content. This ensures that design decisions are informed by both quantitative data from heatmaps and qualitative insights from surveys. For example, if users report difficulties navigating a landing page and heatmaps show low engagement with certain elements, businesses can prioritize redesigning these areas. This leads to enhanced user engagement and a smoother user journey, ultimately improving conversion rates.
Testing and refining designs using visual questions, heatmaps, and traditional surveys before full-scale implementation helps identify and address potential issues early. Utilizing heatmaps can refine marketing efforts and improve user experience, leading to cost savings. This proactive approach reduces the need for costly redesigns and modifications post-launch. By ensuring that designs are effective from the start, businesses can avoid the expenses associated with underperforming campaigns. Investing in this integrated methodology leads to significant cost savings by minimizing wasted resources and maximizing return on investment.
Design the Study: Develop visual mockups and prepare visual question and traditional survey questions. Ensure questions are specific to the visual elements being tested.
Recruit Participants: Select a representative sample of your target audience to participate in the study.
Conduct the Test: Present the mockups to participants and collect data on their interactions using visual questions and heatmaps. Simultaneously, ask them to complete the survey questions to gather qualitative insights.
Analyze the Data: Combine the quantitative data from visual questions and heatmaps with the qualitative data from survey responses. Look for patterns and correlations that can inform design decisions.
Implement Changes: Use the insights gained to refine your designs, focusing on areas identified as needing improvement through both visual data and user feedback.
Integrating visual questions and heatmaps with traditional survey questions provides a comprehensive and nuanced understanding of user interactions and preferences. This combined approach not only enhances the clarity of visual data but also reveals the motivations behind user behavior. By leveraging these insights, businesses can make more informed and effective design decisions, leading to better engagement, increased conversions, and reduced costs. Embracing this integrated methodology ensures that your designs are both visually appealing and highly functional, ultimately driving better business outcomes.
This comprehensive approach to analyzing user behavior through heatmaps, visual questions, and traditional survey questions provides valuable insights that are crucial for optimizing website content and enhancing the overall user experience.
YourCX provides innovative tools that enhance advertising campaigns and interfaces design by analysing user interactions with visual elements. They offer unique solutions in studying user behaviour, reporting results, and implementing changes quickly.
YourCX offers comprehensive tools for researching, analyzing and optimising customer experiences. One of their key offerings is their platform for analysing customer feedback through heatmaps and clickmaps. These tools visually represent data, allowing companies to easily spot trends and areas of interest based on customer feedback.
Their platform also automates the analysis and categorisation of open-ended survey responses. This helps businesses understand customer sentiment quickly and accurately. Their solutions are designed to save time and provide actionable insights.
Heatmaps and clickmaps from YourCX offer a clear picture of how users interact with visual elements on a website. By analysing these interactions, companies can identify and fix user interface problems, such as unclickable elements and broken links, using heatmaps to improve the overall user experience. By analysing these interactions, companies can identify which parts of a page or image, or mockup attract the most attention and which are ignored.
This data helps businesses optimise the design and placement of visual elements to boost engagement. Understanding user behaviour through these tools enables more effective and targeted advertising campaigns.
The platform provides detailed reports based on the data collected. Heatmaps help understand how users engage with the image, including which content they interact with the most. Yourcx.io‘s automation capabilities make the analysis process quick and accurate. These reports summarise user interactions, highlighting key metrics and trends.

Data analysis options:
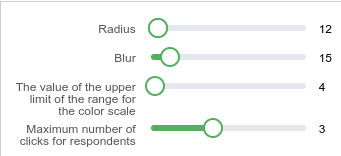
Analyst can change visualisation and filter data in few ways:
Radius - change radius of circle representing group of clicks
Blur - change blur of circle colors
Upper limit of the range for color scale - helps finding points with most clicks if there are lots of this kind of points
Maximum number of clicks for respondents - if respondent is allowed to point many areas, analyst can limit visualisation to analyze only X first clicks of all user click stream
Using all data analysis options gives opportunity to get insights fast.
Businesses can use these insights to make informed decisions about their advertising strategies. The reporting tools also help track the effectiveness of changes made, ensuring that campaigns are continually optimised for better performance.
YourCX enables rapid changes based on the insights gleaned from their tools. The platform's ease of use and automated processes allow businesses to respond to data quickly. This agility is crucial in the fast-paced world of online advertising.
By implementing changes swiftly, companies can improve user experience and campaign effectiveness in real time. This proactive approach helps maintain a competitive edge and ensures that advertising efforts are always aligned with user needs.
At YourCX, we specialize in designing, conducting, and presenting comprehensive studies that integrate visual questions and traditional survey questions. Our advanced methodologies provide a holistic view of user behavior, helping you understand how users interact with your web pages and optimize your content for enhanced user engagement and higher conversion rates.
Tailored Research Design: We customize each study to meet your specific needs, ensuring that we gather the most relevant data about your target audience and their interactions with your website. Whether you're focusing on a landing page, product pages, or your entire site, we have the expertise to deliver valuable insights.
Advanced Analytics Tools: Utilizing own analytics we track user actions and visited pages to create a representation of user interactions and visit path. This data, combined with insights from visual questions and traditional surveys, helps identify patterns and areas for improvement.
Comprehensive Reporting: Our detailed reports present the findings in an easy-to-understand format, highlighting key metrics and actionable insights. We interpret the data to provide clear recommendations for optimizing your website layout, content placement, and overall user experience.
Data-Driven Optimizations: By understanding user preferences and behaviors, we help you make informed decisions that enhance user engagement and satisfaction. Our approach ensures that your marketing strategies are grounded in solid evidence, leading to targeted improvements and increased conversion rates.
Cost-Effective Solutions: By identifying and addressing potential issues early in the design process, we help you avoid costly redesigns and maximize your return on investment. Our research methodologies are designed to provide actionable insights that lead to effective and efficient website optimization.
Seamless Integration: YourCX seamlessly integrates with Google Analytics and Clarity, allowing for an even deeper analysis of user behavior and more comprehensive insights into your website’s performance.
Copyright © 2023. YourCX. All rights reserved — Design by Proformat