

- Research platform
Sources of information
Data analysis
Actions

- Solutions
For whom
Problems / Issues

- Materials
Materials
- About us
About us
The median is an important concept in statistics, providing a way to find the middle value in a dataset. To calculate the median, you need to order the data and find the middle value, or average the two central values if the number of data points is even.
Unlike the mean, which can be impacted by extreme values, the median offers a measure of central tendency that remains stable even when outliers are present.
This makes it a valuable tool for understanding data distributions that are skewed or have unusual values.
The median is the middle value of a data set when it is arranged in ascending or descending order.
The median value is a measure of central tendency that separates the higher half from the lower half of the data.
The median is a robust measure of central tendency that is not skewed by extreme values.
The median is often used as a better representation of the center of a distribution than the mean.
It is a popular summary statistic in descriptive statistics.
The median is used to identify the central position of a data set. It is particularly useful in datasets with skewed data, as it is less affected by extreme values.
Data points are individual values or observations in a data set that represent specific measurements or characteristics. Each data point provides a piece of information that, when combined with others, helps to form a complete picture of the data being analyzed. These points are fundamental in statistical analysis and can vary widely depending on the context of the study.
They can be categorized as either quantitative or qualitative, serving different purposes in data analysis.
Quantitative Data Points:
Definition: Quantitative data points are numerical values that quantify something. They are measurable and can be used to perform arithmetic operations.
Examples: Heights, weights, temperatures, ages, sales figures, or any countable number.
Uses: These data points are often used in statistical analyses to find averages, medians, trends, and correlations. They help in generating insights through mathematical calculations and graphical representations.
Qualitative Data Points:
Definition: Qualitative data points are categorical values that describe attributes or qualities. They are non-numerical and provide descriptive information.
Examples: Colors, names, labels, types of products, customer feedback, and survey responses.
Uses: These data points are used to classify and categorize data, helping in understanding patterns, preferences, and trends in non-numerical contexts. They are essential in fields like market research and social sciences where understanding the quality and nature of data is crucial.
The median is a crucial measure in statistics that represents the middle value of a data set. To find the median, one must identify the middle value of the data set. It divides the data into two equal halves, where half of the data points are below the median, and half are above it. The middle number is the value that divides the data set into two equal halves. Calculating the median depends on whether the number of data points in the set is odd or even.
When the number of data points is odd, the median is straightforward to determine. It is simply the value that lies in the middle of the ordered data set.
Example: Consider the data set 1, 3, 5, 7, 9.
Step 1: Arrange the data in ascending order (already arranged in this case).
Step 2: Identify the middle value.
The median is the middle value, which in this case is 5.
This method ensures that the median divides the data set into two equal parts, with one part having values less than the median and the other part having values greater than the median.
When the number of data points is even, there is no single middle value. Instead, the median is calculated by taking the average of the two central values.
Example: Consider the data set 1, 3, 5, 7, 9, 11.
Step 1: Arrange the data in ascending order (already arranged in this case).
Step 2: Identify the two middle values, which are 5 and 7.
Step 3: Calculate the average of these two central values.
The median is (5 + 7) / 2 = 6.
The median formula varies depending on whether the data is ungrouped or grouped and the number of observations. Here’s how to determine the median for both types of data sets:
For ungrouped data, the median can be found using a straightforward formula. This formula assumes that the data set is ordered from smallest to largest.
Formula:

where n is the number of data points. For an even number of observations, the median is found by averaging the two central values.
Example: Consider the data set 1, 2, 3, 4, 5.
n = 5

The median is the 3rd value in the ordered data set, which is 3.
For grouped data, the median is calculated using a more complex formula that takes into account the class intervals and their frequencies.
Formula:

where:
l = lower limit of the median class
n = total number of data points
cf = cumulative frequency of the class before the median class
f = frequency of the median class
h = width of the class interval
Grouped Data Example:
Consider the following grouped data:
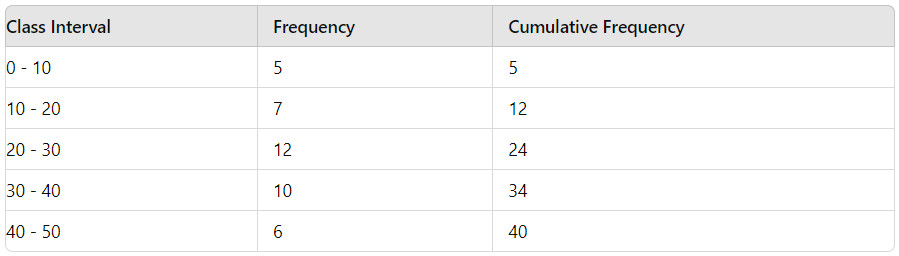
Total number of data points n = 40
Median class: The class where the cumulative frequency reaches or exceeds n/2 = 20
Median class is 20 - 30 (since the cumulative frequency up to 10 - 20 is 12 and adding the frequency of 20 - 30 makes it 24, which exceeds 20)
l (lower limit of the median class)= 20
cf (cumulative frequency before median class) = 12
f (frequency of median class) = 12
h (width of class interval) = 10
Using the formula:

Thus, the median is approximately 26.67
The median offers many advantages but comes with its own set of challenges. These challenges often arise from limitations in its application and its behavior in skewed distributions.
The median can be less informative when dealing with small datasets. In small samples, slight changes in a single data point can shift the median significantly. For instance, in a set of 5 values, changing one number can alter the median more drastically than it would in a set of 50 values.
Median does not use all data values in its calculations.
Unlike the mean, which considers every data point, the median only looks at the middle value(s). This can result in a loss of information about the dataset's distribution.
Another limitation is its inability to be used in further mathematical calculations. While the mean can be easily incorporated into formulas and statistical tests, the median lacks this flexibility. This makes it less useful in various statistical models and algorithms.
In skewed distributions, the median has both strengths and challenges. It remains a robust measure of central tendency when data is heavily skewed, as it is not affected by extreme values.
For example, in income data that includes extremely high earners, the median provides a more representative central value than the mean. However, interpreting the median in skewed distributions can sometimes be misleading.
While it correctly identifies the middle value, it does not reflect the extent of the skew. For instance, two datasets can have the same median but vastly different spreads and shapes.
Choosing the median in skewed distributions may also overlook significant outliers. The outliers do not influence the median, so important trends or anomalies in the data distribution might be missed or underrepresented.
Income Distributions:
Application: The median is often used to represent income distributions in economic studies. Since income data is typically skewed with a small number of very high incomes, the mean can be misleading.
Example: Governments and economists use the median income to better understand the typical income of a population, avoiding the distortion caused by extremely high earners. For instance, when reporting on the economic well-being of a community, the median income provides a clearer picture of the typical experience than the mean income.
Marketing Research:
Application: In marketing research, the median is used to analyze consumer behavior and preferences. It helps in understanding the central tendency of survey responses, purchase amounts, or any other measurable attribute.
Example: Marketers use the median to determine the typical spending of customers on a particular product. If a few customers make very large purchases while most make smaller ones, the median spending amount provides a more accurate representation of typical customer behavior than the mean.
Education:
Application: In education, the median is used to determine the median score of students, which helps to understand the typical performance of a student group without being affected by extremely high or low scores.
Example: Schools and educational researchers use the median score on standardized tests to gauge the typical performance level of students. This is particularly useful in large classrooms or districts where a few very high or very low scores could skew the average.
Understanding the median through graphs like histograms and box plots can help visualize the central tendency of data. These visual tools clarify how the median relates to the data set.
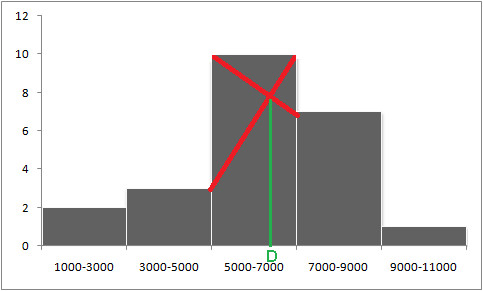
Histograms display the distribution of data using bars, each representing the frequency of values within a range. The median is found by identifying the point where half of the data lies below and half above.
For a symmetric distribution, like heights of college females, the median aligns with the mean and mode, often in the center of the histogram.
In skewed distributions, the median provides a better central value than the mean, as it is not affected by extreme values. Using histograms allows easy visual identification of the median by showing the cumulative frequency.

Box plots, or box-and-whisker plots, present data by displaying its distribution through quartiles. The median is the line inside the box that divides it into two parts.
The box itself shows the interquartile range (IQR), from the first (Q1) to the third quartile (Q3).
This graphical representation highlights outliers and the spread of the data.
In skewed distributions, the median line may be off-center, indicating the skewness.
Box plots help visually compare medians across different data sets or groups, making them a powerful tool for comparing variations between distributions.
The mean, median, and mode are all measures of central tendency used to summarize data, each providing different insights about the data set. Understanding the relationship between these measures is essential for data analysis.
Symmetrical Distributions: In a perfectly symmetrical distribution (e.g., a normal distribution), the mean, median, and mode are equal.
Mean = Median = Mode
Skewed Distributions: In skewed distributions, the mean, median, and mode typically do not coincide.
Positively Skewed (Right Skewed): The mean is greater than the median, which is greater than the mode.
Mode < Median < Mean
Negatively Skewed (Left Skewed): The mean is less than the median, which is less than the mode.
Mean < Median < Mode
Understanding these relationships helps in identifying the nature of the data distribution and choosing the appropriate measure of central tendency for analysis.
This section explores how the median can be applied in more complex scenarios, like in multivariate data analysis and generalized settings, providing deeper insights into its practical uses.
The multivariate median extends the concept of the median to multiple dimensions. It identifies a central point in a multidimensional space, such as in a dataset with multiple variables.
One common method to find this median is the geometric median. This point minimizes the sum of distances to all other points in the dataset, unlike the univariate median that only considers a single dimension.
An important property of the geometric median is its robustness to outliers. If the data points are spread unevenly, the geometric median provides a more accurate central location than the arithmetic mean.
Applications of the multivariate median include clustering and outlier detection in high-dimensional data.
There are several ways to generalize the concept of the median beyond basic datasets. One common generalization is the weighted median, where each data point is assigned a weight.
The weighted median splits the data such that the sum of weights is balanced on either side. This concept is useful in contexts where certain data points are more significant than others, like in weighted voting systems or financial models.
Another generalization is the median of medians algorithm, which efficiently finds an approximate median in large datasets. This algorithm works by dividing the dataset into smaller groups, finding the median of each group, and then determining the median of those medians. This method is particularly useful in scenarios requiring quick and approximate solutions.
Copyright © 2023. YourCX. All rights reserved — Design by Proformat
