

- Research platform
Sources of information
Data analysis
Actions

- Solutions
For whom
Problems / Issues

- Materials
Materials
- About us
About us
The System Usability Scale (SUS) is a key tool in user experience (UX) research. It helps measure how easy products or systems are to use. The SUS has been around since the 1980s and is still widely used today.
The SUS uses 10 standard questions to check how users feel about a product. This quick survey gives UX teams useful data about their designs. It's a simple way to see if people find a product easy or hard to use.
UX pros like the SUS because it works well for many types of products. It can be used for websites, apps, or even physical items. The results are easy to understand and compare. This makes the SUS a popular choice for UX testing.
The SUS is a fast, reliable way to measure product usability
It uses a set of 10 questions to gather user feedback
SUS scores help teams compare different designs and track progress
The System Usability Scale has evolved from a simple tool to an essential part of UX research. Its creation and widespread adoption have shaped how researchers measure usability.
John Brooke created the System Usability Scale in the 1980s. He designed it as a quick way to check user experience for systems with command-line interfaces.
The SUS started as a "quick and dirty" method. It was first used to test VT100 Terminal applications. These were the green-screen systems common at the time. Over the years, the SUS proved its worth. It showed it could work for many types of technology. Researchers have used it to test hardware, software, and websites.
The scale's simplicity helped it spread. It uses just 10 questions. This makes it easy to give and quick to complete.
The SUS became a key tool in UX research. It offers a standard way to measure how easy products are to use.
Researchers like the SUS because it's reliable. Studies show it gives consistent results. It also works well with small sample sizes. The scale helps teams track progress. They can test products at different stages. This lets them see if changes improve usability.
Many companies now use the SUS. It helps them compare their products to others. This creates a common language for usability in the tech world. The SUS has inspired new research. People keep studying how to use it better. This work ensures the scale stays useful as technology changes.
The System Usability Scale offers a quick way to measure how easy a product is to use. It uses simple questions to get useful feedback from people who try out websites, apps, or devices.
The System Usability Scale (SUS) is a tool used in user experience research. It helps measure how user-friendly a product or system is. The SUS gives a score that shows if people find something easy or hard to use.
Companies use the SUS to:
Check if their products work well for users
Compare different versions of a product
See how they stack up against competitors
The SUS is popular because it's quick and easy to use. It works for many types of products, from websites to physical devices.
The SUS uses 10 questions to get user feedback. Users rate each item from 1 (strongly disagree) to 5 (strongly agree). The questions cover different aspects of usability.
Here's how the scoring works:
For odd-numbered questions, subtract 1 from the score.
For even-numbered questions, subtract the score from 5.
Add up all these new values.
Multiply the total by 2.5.
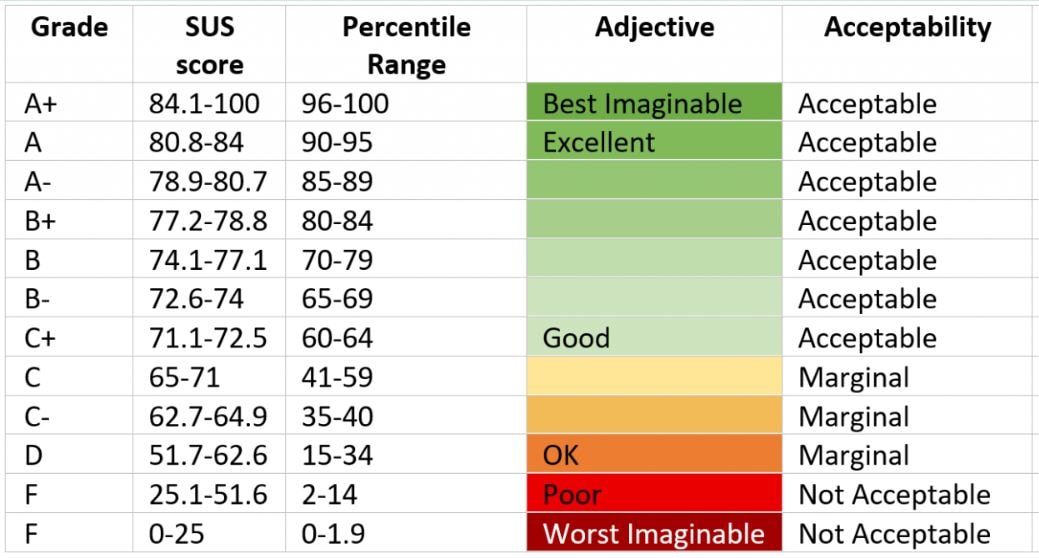
This gives a final score between 0 and 100. A score above 68 is considered above average. Scores in the high 70s and 80s are very good, while anything over 90 is excellent.

The System Usability Scale survey requires careful planning and design. Key aspects include crafting clear questions and considering the context in which the survey will be administered.
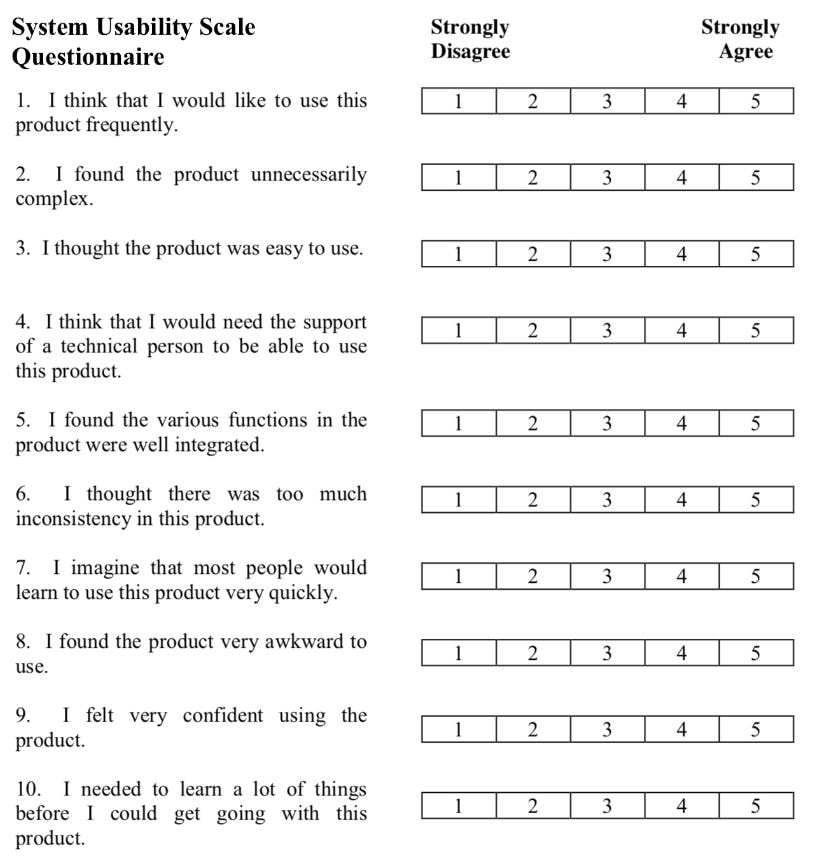
The SUS questionnaire consists of 10 standard questions. These questions alternate between positive and negative statements about the system's usability. This design helps reduce response bias.
The questions use simple language to ensure clarity. They cover different aspects of usability, such as ease of use, consistency, and user confidence.
Here are the 10 SUS questions:
I think that I would like to use this system frequently.
I found the system unnecessarily complex.
I thought the system was easy to use.
I think that I would need the support of a technical person to be able to use this system.
I found the various functions in this system were well integrated.
I thought there was too much inconsistency in this system.
I would imagine that most people would learn to use this system very quickly.
I found the system very cumbersome to use.
I felt very confident using the system.
I needed to learn a lot of things before I could get going with this system
When preparing the SUS survey, it's crucial to consider the context in which it will be used. The timing of the survey is important. It's best to administer it right after users have interacted with the system.
The SUS can be used for various products, including websites, software, and hardware. Researchers should adapt the wording slightly to fit their specific product.
It's also important to decide on the survey format. Digital surveys are common, but paper versions can be useful in certain situations. The choice depends on the testing environment and participant preferences.

The System Usability Scale requires careful implementation to gather accurate data. Proper procedures and avoiding common pitfalls are key to successful SUS administration.
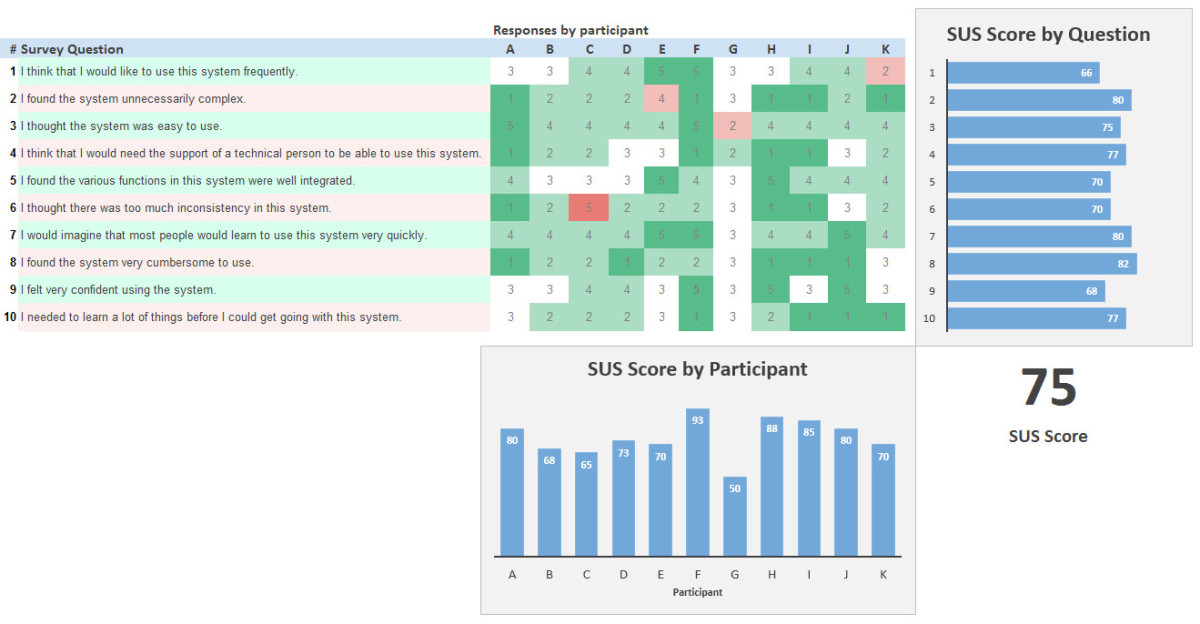
Administer the SUS questionnaire immediately after users interact with the system. Give clear instructions and ensure participants understand the rating scale. Use a 5-point Likert scale from "Strongly Disagree" to "Strongly Agree" for each item.
Keep the testing environment consistent across participants. Allow enough time for thoughtful responses, but avoid letting users overthink their answers. Aim for gut reactions.
Maintain participant anonymity to encourage honest feedback. Collect demographic data separately if needed. Use digital survey tools when possible to streamline data collection and analysis. However, paper forms can work for in-person testing.
Don't modify the standard 10 SUS questions. Changing the wording can impact reliability. If additional questions are needed, add them separately after the SUS items.
Avoid explaining or interpreting questions for participants. This can bias responses. If clarification is necessary, provide it consistently to all users. Don't administer the SUS too long after system use. Delayed responses may not accurately reflect the user experience.
Refrain from discussing the system or sharing opinions with participants before they complete the SUS. This can influence their ratings.
Be cautious about comparing SUS scores across different types of systems or products. Scores are most meaningful when evaluating similar interfaces.
SUS scores provide valuable insights into a system's usability. They help UX researchers and designers gauge user satisfaction and identify areas for improvement.
To calculate the System Usability Scale (SUS) score, follow these steps:
Each response in the SUS questionnaire is assigned a numerical value based on a Likert scale:
Strongly Disagree: 1 point
Disagree: 2 points
Neutral: 3 points
Agree: 4 points
Strongly Agree: 5 points
The SUS consists of 10 questions, which are categorized into odd and even numbered questions:
For odd-numbered questions (1, 3, 5, 7, 9):
Subtract 1 from the participant's score.
For even-numbered questions (2, 4, 6, 8, 10):
Subtract the participant's score from 5.
x: Sum of the adjusted scores from the odd-numbered questions minus 5.
y: 25 minus the sum of the adjusted scores from the even-numbered questions.
Use the formula:
SUS Score=(x+y)×2.5
This calculation will give you a score that ranges from 0 to 100, indicating the perceived usability of the system.
A higher score indicates better usability.
An average SUS score is typically around 68, with scores above this considered above average and scores below indicating potential usability issues.
By following these steps, you can effectively calculate and interpret the SUS score for your usability study
SUS scores are useful for comparing different versions of a product or competing products. They allow researchers to track improvements over time.
To benchmark effectively:
Collect scores for multiple products or versions
Calculate the average score for each
Compare scores to industry standards
The average SUS score across 500 studies is 68. This serves as a good baseline for comparison.
Some researchers use letter grades to interpret scores:
90-100: A (Excellent)
80-89: B (Good)
70-79: C (Acceptable)
60-69: D (Poor)
0-59: F (Unacceptable)
This grading system helps stakeholders quickly understand a product's usability standing.
The System Usability Scale works well in various research settings. It helps measure usability for websites, apps, hardware, and physical products. The SUS gives useful data in each context.
SUS is widely used for testing websites and apps. It helps teams check how easy their digital products are to use. For web usability, SUS scores can show if a site meets user needs. A score above 68 is seen as above average for websites.
Mobile apps also benefit from SUS testing. Researchers can compare SUS scores between app versions. This helps track if changes improve usability. SUS questions work well on small screens, making it easy to gather feedback after mobile testing.
Some teams use SUS along with other UX methods. They might combine it with task success rates or time-on-task data. This gives a fuller picture of the user experience.
SUS is not just for digital products. It also works well for hardware and physical items. Researchers use it to test things like:
Remote controls
Kitchen appliances
Medical devices
Car dashboards
The standard SUS questions fit many types of products. For example, "I found this system easy to use" works for both apps and toasters.
SUS helps compare different product designs. Teams can test prototypes and see which scores higher. This guides them toward more user-friendly options. Physical product tests often pair SUS with hands-on tasks. Users might try out a product, then fill out the SUS. This shows how well the item performed in real use.
The System Usability Scale offers more than just numbers. It can provide rich qualitative data to help improve user experiences. Open-ended feedback and a mix of data types enhance the value of SUS results.
SUS questionnaires often include space for comments. These open-ended responses give users a chance to explain their ratings. They can point out specific issues or praise certain features.
Common themes in comments may reveal:
Usability problems
Confusing interface elements
Favorite or least favorite aspects
Analyzing these comments helps prioritize improvements. It puts context behind the numbers and shows what matters most to users.
SUS provides both types of data. The numeric scores are quantitative. They show how usable a system is overall. The comments and explanations are qualitative. They explain why users feel that way.
Combining these data types gives a fuller picture. Numbers show trends and allow comparisons. Comments explain those trends and suggest fixes.
For example, a low score in ease of use might be explained by comments about a confusing menu structure. This mix of data helps UX teams make informed decisions about what to improve and how.
The System Usability Scale has been used to assess usability in various industries. It has proven valuable for evaluating digital products and services across different sectors.
Several banks have used SUS to improve their online and mobile banking platforms. A large US bank applied SUS to test their new mobile app. The initial score was 62, below the average of 68.
They made changes based on user feedback:
Simplified navigation
Improved transaction history layout
Added fingerprint login
After updates, the SUS score rose to 76. This showed clear usability improvements.
Another bank used SUS to compare their website to competitors. Their score of 82 was higher than the industry average of 73. This data helped them market their user-friendly online banking services.
E-commerce sites often use SUS to enhance the shopping experience. A major online retailer tested their checkout process using SUS. The initial score was 70.
They made these changes:
Reduced form fields
Added progress indicators
Improved error messages
The SUS score increased to 85 after changes. This led to a 12% rise in completed purchases.
A smaller e-commerce site used SUS to test different product page layouts. Version A scored 65, while version B scored 78. They chose version B, which led to a 5% increase in add-to-cart actions.
The System Usability Scale offers key benefits in UX research. It provides a quick, reliable way to measure usability across different products and industries.
The SUS is quick and effective for evaluating product usability. It uses only 10 questions, making it fast to administer and analyze.
This brief format reduces participant fatigue and increases response rates. Despite its simplicity, the SUS has proven highly reliable in numerous studies.
The scale produces consistent results even with small sample sizes. This makes it ideal for teams with limited time and resources.
SUS scores are easy to calculate and interpret. A single number provides a clear snapshot of overall usability.
The SUS works well across many types of systems and products. It can evaluate websites, software, hardware, and even physical objects.
This flexibility allows for comparisons between different industries and product types. Companies can benchmark their usability against competitors or industry standards.
The scale's generic wording makes it suitable for various contexts. It doesn't rely on specific features or jargon tied to one field.
Researchers can use the SUS at different stages of product development. It's helpful for early prototypes and finished products alike.
The System Usability Scale has some drawbacks that can affect its effectiveness. These include potential biases in responses and the risk of misinterpreting results.
The SUS questionnaire can be influenced by various biases. Cultural differences may impact how users interpret and respond to questions. For example, people from different countries might have varying opinions on what constitutes "ease of use."
Language barriers can also skew results. If the SUS is not properly translated, non-native speakers may misunderstand questions.
User familiarity with the system can create bias. Experienced users might rate a system higher simply because they're used to it, not because it's actually more usable.
The context of use can affect scores too. A system might get different ratings when used in a lab setting versus a real-world environment.
SUS scores can be misunderstood or misused. Some people wrongly treat the score as a percentage, leading to incorrect comparisons.
The overall SUS score doesn't pinpoint specific usability issues. It gives a general idea of usability but doesn't explain why a system scored high or low. Comparing SUS scores across different types of systems can be misleading. A score that's good for a website might not be good for a mobile app.
Small sample sizes can lead to unreliable results. Using the SUS with too few participants might not accurately represent the larger user population.
The System Usability Scale is evolving to meet new challenges in user experience research. It continues to adapt to changing technology and user needs while maintaining its core strengths.
The System Usability Scale (SUS) remains a key tool in usability testing. Researchers are exploring ways to update SUS for modern interfaces. This includes versions for mobile apps, voice interfaces, and virtual reality experiences.
Some experts suggest adding questions about accessibility and inclusive design. Others propose incorporating emotional response measures. These changes aim to capture a more complete picture of user experience.
Automated SUS scoring systems are becoming more common. These tools can quickly analyze large datasets and provide real-time insights.
UX professionals are finding new ways to combine SUS with other research methods. Eye-tracking studies paired with SUS scores can reveal usability issues more effectively.
Qualitative feedback is being used to add context to SUS results. This helps explain the reasons behind low or high scores.
Some teams are using SUS alongside task completion rates and time-on-task metrics. This approach gives a more rounded view of usability.
Integrating SUS into continuous user testing processes is becoming more common. This allows teams to track usability improvements over time.
The System Usability Scale (SUS) is a widely used tool in UX research. It helps measure the usability of products and systems. Let's explore some common questions about SUS.
The SUS questionnaire has 10 standard questions. These questions cover different aspects of usability. They ask about how easy the system is to use and how complex it seems.
The questions alternate between positive and negative statements. This design helps prevent bias in responses.
The SUS score ranges from 0 to 100. Higher scores indicate better usability. To calculate the score, researchers follow specific steps.
They first adjust the individual question scores. Then they sum these adjusted scores and multiply by 2.5. The final number represents the overall SUS score.
A SUS score above 68 is considered above average. Scores in the 70s and 80s are good. Anything above 90 is excellent.
These benchmarks help teams understand how their product compares to others. They also guide decisions about needed improvements.
Researchers typically give the SUS survey after users complete tasks with a system. They ask users to answer all 10 questions.
Users rate each statement on a 5-point Likert scale. The scale ranges from "Strongly Disagree" to "Strongly Agree".
The NASA Task Load Index (TLX) is one alternative to SUS. It focuses on workload assessment.
Other options include the Questionnaire for User Interaction Satisfaction (QUIS) and the Software Usability Measurement Inventory (SUMI). These tools offer different perspectives on usability.
SUS remains relevant in modern UX research due to its simplicity and reliability. It works well for both digital and physical products.
Researchers now use SUS alongside other methods like user interviews and analytics. This combination provides a more complete picture of user experience.
Copyright © 2023. YourCX. All rights reserved — Design by Proformat
