

- Research platform
Sources of information
Data analysis
Actions

- Solutions
For whom
Problems / Issues

- Materials
Materials
- About us
About us
Do you know how effective the survey is? Do you know on which questions respondents are most likely to abandon further completion, and thus where to make changes and optimizations? The answer is to analyze the completion rate of questions in a survey, which is a crucial part of the data collection process.
Internal survey question conversion analysis is the process of monitoring and evaluating what percentage of respondents answer subsequent survey questions. With this analysis, it is possible to identify where participants are dropping out of further participation, allowing you to optimize the structure and content of the questionnaire. It is also worth paying attention to the length of the survey, as response rates can vary depending on the length of the survey, the topic and the distribution method.
The completion rate of questions in a survey is extremely important, as it directly affects the quality of the data collected. Analyzing completed surveys helps in understanding the factors that contribute to higher completion rates. The higher the completion rate, the greater the chance that the data is reliable and representative of the target group. A high completion rate means that respondents were engaged and motivated to complete the survey, which in turn translates into better quality data collected. A low completion rate may indicate problems with the survey.If we notice that on a particular question many respondents stop completing the survey, it may indicate that it is not understood or too complicated.
Response monitoring: Track how many respondents answer each question and at which stage of the survey there is the greatest churn
Statistical analysis: Use analytical tools to present distributions of responses to individual questions in the form of tables or charts, making it easier to identify problem areas
Testing and optimization: Based on the collected data, make changes to the questionnaire, such as simplifying questions, changing their order or eliminating redundant questions.
The test verified two variants, the differences of which began with question 8:
A - questions 8, 9 and 10 were shown on one page, on the next page 11 and 12, then 13 and 14, and then 15 and 16
B - question 8 and 9 were shown on one page, then 11, then on the next page 13, and on the last page question 15. Questions 10, 12, 14, 16 were hidden from respondents
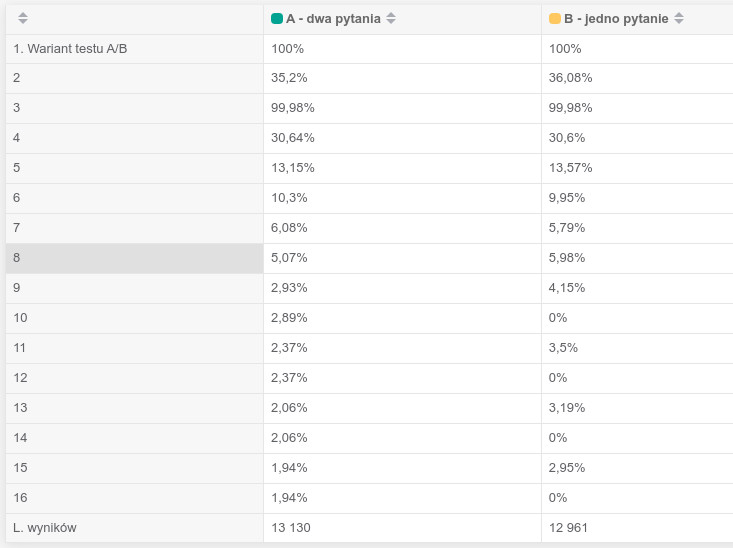
Structure of the test:
Variant A contained more questions (8-16), presented in pairs of two per page.
Variant B contained fewer questions. Hidden were questions that logically partially duplicated those left behind
Major differences in conversions:
At the level of question 8, the conversion rate is slightly higher in Variant B (5.98%) than in Variant A (5.07%), which may indicate that reducing the number of questions on a page with questions 8, 9 and 10 had a beneficial effect on respondent engagement.
The differences become more noticeable in subsequent questions, e.g., question 9: variant B (4.15%) vs. variant A (2.93%) - variant B continues to maintain a higher conversion rate, confirming the positive impact of simplifying the survey structure.
Significantly, Variant A records a continuous, gradual reduction in response rates with successive questions, while Variant B, although losing respondents, does so less sharply.
Variant B respondents are less likely to abandon the survey after question 8, suggesting that a shorter and less complex questionnaire better maintains their attention and motivation.
Recommendations:
It is worth considering reducing the number of questions or reducing the number of questions on a single page, as this clearly translates into improved completion rates.
It may be a better practice to select key questions and hide less important questions (or move them further away), which will increase respondent satisfaction, improving data quality.
In conclusion, Option B - with fewer questions and pages - showed a clear advantage in terms of respondent retention and should be recommended as a benchmark for further survey optimizations.
The data was segmented by day of the week and refers to a survey that does not need to be sent every day.
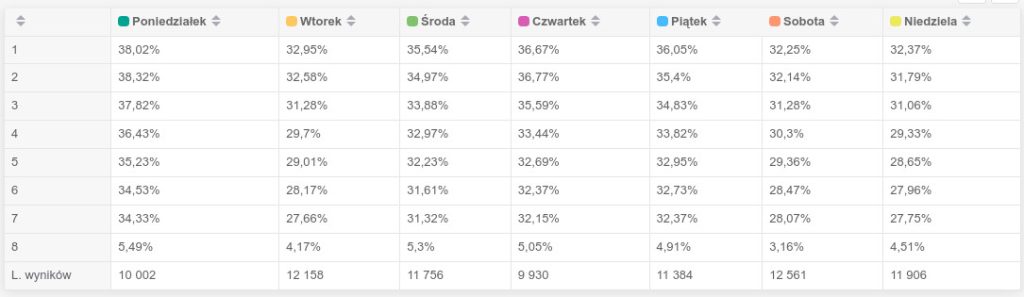
Clear differences in conversions between days:
The highest initial conversion (first questions) is seen on Mondays (about 38%) and Thursdays and Fridays (about 36-37%). A lower initial conversion is seen especially on Tuesdays, Saturdays and Sundays (about 32-33%), indicating that respondents are harder to engage on these days.
Gradual decline in conversion
All days show a gradual but steady decline in conversions with successive questions. This is a natural trend, typical of most surveys. The most rapid decline in conversion was observed on Tuesdays, where retention drops from an initial 32.95% to just 4.17% at the end. The most stable conversion across questions is seen on Mondays and Thursdays, although even on the last question conversion drops to around 5%.
Conclusion
Mondays and Thursdays seem to be the best days to send out surveys, as both initial and final conversions are the highest and the drop-off is the least violent. If a survey does not need to be sent every day, it is best to send it on these days of the week.

A clear drop in conversion with each successive demographic question:
The most problematic question is the gender question, which causes conversions to drop by more than half.
The next questions - age, education and zip code - show steep drops. The drop is particularly large with the postal code question, where conversion drops to about 27.36% (mobile) and 33.06% (desktop).
Differences between mobile and desktop:
Mobile users have a higher conversion rate than desktop users at first (when asked about gender), but their conversion rate drops faster with subsequent questions.
When asked about age, desktop users (51.53%) hold up better than mobile users (49.47%), and this desktop advantage is even more pronounced with subsequent questions (education and zip code).
Conclusions and recommendations
Demographic questions at the beginning of the survey can significantly reduce the conversion rate, especially on mobile devices, where users are more sensitive to the length and detail of the survey.
It is worth moving demographic questions to the end of the survey, when respondents are already more engaged and motivated to complete the entire survey. This will likely increase the overall retention of the survey.
Specific questions (like zip code) are worth simplifying or minimizing, especially in a mobile context, to avoid a sharp drop in respondent engagement.
In conclusion, the analysis clearly shows that demographic questions at the outset significantly reduce the survey completion rate, especially in the mobile version. Optimizing the order and form of questions is therefore key to increasing survey conversion.
Copyright © 2023. YourCX. All rights reserved — Design by Proformat
