


- Research platform
Sources of information
Data analysis
Actions

- Solutions
For whom
Problems / Issues

- Materials
Materials
- About us
About us
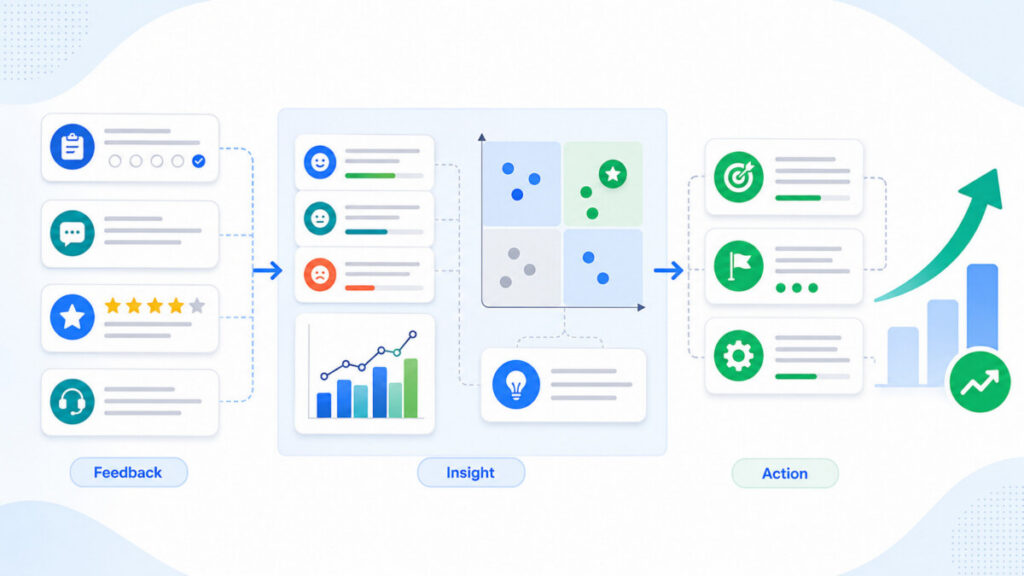
Customer feedback analytics turns surveys, reviews, support conversations, and behavioral data into actionable customer insights. It helps organizations understand not only what customers do—such as abandon a journey or cancel a service—but why. Used well, it supports measurable CX improvement across service, product, marketing, and operations.
Customer feedback analytics is the structured collection, integration, and analysis of customer opinions and experience data. Sources may include survey scores, written comments, online reviews, support transcripts, complaints, product feedback, website behavior, and account information.
It differs from feedback collection, which produces responses but does not interpret them. It is also broader than customer feedback management, which covers requesting, routing, responding to, and closing the loop on feedback. Analytics identifies patterns, drivers, experience gaps, emerging risks, and whether action worked.
For CX teams, its value lies in connecting experience signals to business outcomes. Analysis may show that:
This creates a stronger basis for data-driven decision making. Instead of treating comments as isolated anecdotes, teams can assess frequency, severity, affected segments, operational causes, and potential business impact.
A useful program combines several sources:
Each source provides a different perspective. Surveys offer structured measures but may be affected by response bias. Support conversations provide context but are often unstructured. Web analytics shows observed behavior, while comments explain motivations. Combining them is central to improving CX.
Quantitative signals include scores, ratings, response rates, churn, conversion, repeat contacts, resolution times, and complaint volumes. They support comparisons and trend analysis.
Qualitative signals include themes, sentiment, intent, emotion, root causes, urgency, severity, and verbatims. They explain the meaning behind scores and reveal needs not anticipated by survey questions.
Neither is sufficient alone. A falling CSAT may signal a problem, while comments reveal whether it concerns policy, communication, usability, or agent behavior. A frequently mentioned complaint may still be a lower priority if it has limited customer or business impact.
Reliable feedback programs begin with a decision, not a dashboard. Define the business question or CX outcome before selecting questions, channels, or tools.
Possible objectives include:
The objective determines the required data. A post-contact CSAT study may need contact reason, channel, agent group, transfer history, resolution status, repeat contacts, and comments. Checkout-abandonment analysis may require pages, devices, traffic sources, funnel steps, feedback, and conversion outcomes.
Define:
Map each objective to its data and action. Document:
Analysis should not stop at identifying a theme. It should specify who will investigate it, what intervention is possible, and when the outcome will be reassessed.
Feedback held in separate survey, CRM, review, support, and product systems is difficult to interpret consistently. Centralization does not require one physical database, but it does require a common structure for connecting and comparing records.
Preserve, where appropriate:
This context prevents misleading conclusions. The same complaint may have different implications during onboarding and renewal. A low rating after an unresolved issue differs from one caused by an isolated technical incident.
A Voice-of-the-Customer model connects feedback to profiles, transactions, subscriptions, cases, journeys, and operational events. Distinguish raw from interpreted data:
Keep original feedback traceable. Teams should be able to move from an aggregate result—such as more negative billing comments—to representative verbatims and underlying cases. This supports quality assurance, root-cause analysis, and responsible text analytics.
Standardize scales, taxonomies, sentiment labels, and metadata where comparison is needed. Use shared top-level categories with controlled local detail when markets, products, or service teams require different context.
Tools may include survey platforms, text analytics, review monitoring, CRM and contact-center integrations, and business intelligence systems. Select them after defining the measurement plan.
Evaluate:
Automation can process large volumes, but ambiguous comments, sarcasm, mixed sentiment, sensitive complaints, and high-risk issues require human review.
The method should match the decision:
Segment results by customer value, lifecycle, product, geography, channel, journey stage, and operational unit. Overall scores can conceal differences between new and existing customers, self-service and assisted journeys, or strategic accounts and low-engagement users.
Categorize comments into consistent topics, subtopics, intents, and root causes. Interpret sentiment alongside topic, severity, and customer context.
Ask:
Topic frequency alone is not a prioritization method. A rare safety, privacy, or compliance issue may require faster escalation than a common inconvenience.
Driver analysis relates NPS, CSAT, CES, or another outcome to specific attributes or experiences using methods such as correlation, regression, or segmentation.
Interpret results carefully:
Compare promoters, passives, and detractors, but also retained and churned customers, resolved and unresolved cases, and customers who converted or abandoned. Stronger insights often emerge when stated experience is compared with actual behavior.
Analyze results by time, channel, segment, journey stage, and operational unit. Investigate whether changes reflect:
An experience gap occurs when customer expectations and delivered performance diverge. Internal service-level compliance does not necessarily mean customers found the journey easy or effective.
Choose metrics that support the defined objective. No single measure represents the entire customer relationship.
Connect feedback metrics to:
Track outcome and process metrics together. Resolution time may explain a CSAT change, while rising positive sentiment may be misleading if response volume has fallen sharply.
Feedback measurement is vulnerable to sampling and nonresponse bias, survey fatigue, duplicate responses, wording, timing, and channel effects. To protect interpretation:
Integrated feedback combines observed behavior with stated experience. Web analytics may show where customers exit a journey; feedback can indicate whether the cause was unclear content, price, trust, technical difficulty, or an unmet need.
Where privacy and identity controls permit, associate feedback with:
This enables questions such as:
Behavior and feedback are complementary, not interchangeable. A customer may be satisfied with a website but fail to convert because of price, timing, or another unrelated need.
Link complaints and themes to cases, agents, locations, products, processes, and service-level results. Compare perceived effort with resolution time, transfers, repeat contacts, and escalations.
For product teams, connect feedback to:
Create alerts for high-severity issues affecting strategic accounts, vulnerable customers, regulated processes, or trust and safety. Route each alert to an accountable team with a defined response.
An integrated insight layer requires shared taxonomies, customer identifiers, event timestamps, and consistent journey definitions. Dashboards should let users move from aggregate metrics to segments, operational evidence, and original comments.
Document data lineage, refresh frequency, identity-matching rules, integration gaps, classification logic, and access controls. Use role-based access to support analysis while limiting unnecessary customer-level visibility.
Analytics creates value only when it changes a decision, process, product, or interaction. Each priority issue should have an owner, intervention, deadline, and expected outcome.
Distinguish between:
Rank issues using:
A weighted score or impact-versus-effort matrix can clarify trade-offs. Do not let the loudest feedback become the default priority; consider silent customers, affected populations, customer value, and the consequences of inaction.
Online reviews are continuous, unsolicited feedback that can reveal issues missed by surveys and influence trust and consideration.
Monitor:
Review optimization should improve the experience and support credible responses, not manipulate ratings. Practices include:
Compare review themes with support complaints, returns, churn, conversion, location performance, and product data. This shows whether a reputation issue is isolated or reflects broader operational weakness.
After an intervention, measure rating distribution, sentiment, review volume, issue recurrence, and related business outcomes. A better average rating without fewer recurring complaints may indicate communication improvement rather than structural CX improvement.
Start with one focused use case, such as reducing repeat contacts or improving checkout completion. Establish decision rights and escalation rules before building an enterprise dashboard. Expand only after data, ownership, and action are reliable and measurable.
Broad coverage improves visibility but increases integration complexity, privacy obligations, cost, and ambiguity. Standardization enables comparison, while excessive standardization can remove local or journey-specific context. Automation accelerates classification, but human review protects accuracy in complex cases.
Common mistakes include:
A dashboard is not a feedback operating model. It becomes valuable when findings lead to recovery, experimentation, process redesign, investment decisions, and measured learning.
Customer feedback analytics should operate as a cycle:
Use closed-loop feedback for individual recovery and strategic feedback for systemic improvement. Review surveys, integrations, taxonomies, and dashboards as customer needs and operating models evolve.
To measure a CX change, compare pre- and post-intervention results using consistent methods. Where practical, use phased rollouts, comparison groups, or experiments. Assess unintended effects, segment differences, and whether improvement is sustained.
Assign ownership for feedback data and quality, analysis, operational action, executive reporting, privacy, access, and escalation of safety, compliance, trust, or reputation issues. A shared repository of findings, decisions, interventions, and outcomes prevents repeated rediscovery of the same problems.
Customer feedback analytics transforms structured and unstructured feedback into patterns, drivers, experience gaps, and decisions. It connects customer opinions to operational performance, behavior, retention, reputation, and other outcomes, making feedback more useful than collection or reporting alone.
Data-driven decisions help teams prioritize changes by customer impact, evidence, effort, and business risk. Combining feedback with web and operational data reveals both customer motivations and observed behavior, allowing teams to measure whether an intervention improves the intended outcome.
Start with a clear objective, use appropriate sampling and timing, centralize relevant sources, apply consistent metrics, segment results, and validate automated analysis with qualitative review. Connect insights to owners, establish governance, close the loop, and measure outcomes after action.
Relevant metrics include NPS, CSAT, CES, sentiment, topic frequency, response and completion rates, complaints, escalations, review ratings, and resolution performance. Pair customer-reported measures with outcomes such as conversion, repeat contacts, retention, or churn.
Where privacy controls permit, associate feedback with pages, sessions, journey paths, devices, funnel stages, acquisition sources, and conversion outcomes. This lets teams compare reported friction with observed digital behavior.
Validate the signal, identify root causes, quantify affected customers, prioritize an intervention, and assign an owner. Define a target and review date, implement the change, compare post-change feedback with operational and behavioral outcomes, and record the result for future decisions.
Customer feedback analytics converts surveys, reviews, support interactions, and behavioral signals into actionable customer insights. Its greatest value comes from integration: combining quantitative metrics and web analytics with qualitative evidence about customer needs, motivations, and frustration.
The operating principle is straightforward: define the decision, centralize the evidence, analyze it in context, act through accountable teams, and measure the result. With disciplined customer feedback management and Voice-of-the-Customer governance, businesses can make better data-driven decisions, prioritize meaningful CX improvement, and build a continuous system for learning from customers.
Copyright © 2023. YourCX. All rights reserved — Design by Proformat
