


- Research platform
Sources of information
Data analysis
Actions

- Solutions
For whom
Problems / Issues

- Materials
Materials
- About us
About us
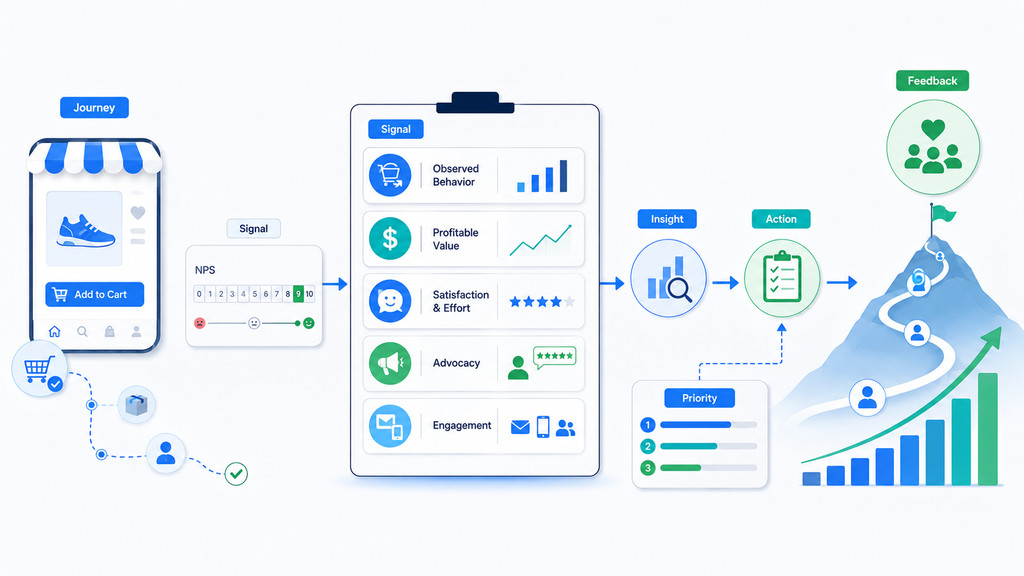
Customer loyalty in ecommerce is broader than willingness to recommend a brand. A strong measurement approach combines NPS alternatives with purchasing behavior, profitability, customer-experience feedback, advocacy, and engagement. Together, these metrics show whether customers return, prefer the brand, create value, and remain loyal without excessive incentives.
Net Promoter Score (NPS) asks:
> “On a scale of 0 to 10, how likely are you to recommend this company, product, or brand to a friend or colleague?”
Responses are grouped into:
NPS = % Promoters − % Detractors
NPS provides a consistent relationship-health and advocacy signal. Tracked over time, it can reveal experience changes after delivery disruptions, checkout changes, product issues, or service recovery. Open-text responses can support root-cause analysis.
However, NPS measures stated recommendation intent. It does not show whether customers repurchase, buy at full margin, resist competitor offers, or remain active within an appropriate buying cycle.
Use NPS alongside transaction, margin, service, return, loyalty-program, and customer-feedback data.
NPS can help with:
Treat NPS as a relationship and advocacy indicator, then connect it to subsequent behavior. For example, test whether detractors have higher return rates or lower second-purchase rates, and whether promoters generate more referrals or reviews.
NPS should rarely be the sole executive target, loyalty-program success measure, or compensation metric.
A robust framework covers five dimensions:
| Dimension | What it reveals | Example metrics |
|---|---|---|
| Behavioral | What customers do | Retention, repeat purchase rate, recency, frequency |
| Economic | Whether loyalty creates profitable value | CM-CLV, margin per customer, margin retention |
| Attitudinal | How customers perceive the relationship | CSAT, CES, preference, emotional loyalty |
| Advocacy | Whether customers recommend or represent the brand | Referrals, reviews, ratings, UGC |
| Engagement | The continuity of participation | App, email, rewards, and community activity |
This creates a useful loyalty signal hierarchy:
No single signal proves loyalty. A repeat buyer may be promotion-dependent, an engaged program member may have been loyal before joining, and a promoter may have no reason to purchase again soon. Account for purchase necessity, convenience, economic lock-in, and genuine brand preference.
Behavioral metrics use customer activity rather than survey responses. Their value depends on appropriate time windows and segmentation.
Repeat Purchase Rate = Customers with 2+ purchases ÷ Total purchasing customers × 100
This shows whether customers return after an initial order. Compare it across acquisition cohorts, categories, first-order experiences, and post-purchase interventions.
Match the observation window to the product’s buying cycle. Segment by first-order discount, acquisition source, category, and return behavior so promotions are not mistaken for loyalty.
Retention Rate = (Customers at period end − New customers acquired) ÷ Customers at period start × 100
Track monthly, quarterly, and annual retention, preferably by cohort. Distinguish:
For irregular purchases, survival analysis or cohort curves may be more accurate than a fixed churn threshold.
Purchase Frequency = Total orders ÷ Unique customers
Frequency reveals purchasing cadence and supports lifecycle segmentation. High frequency does not automatically mean loyalty; it may reflect low-margin transactions, heavy discounting, fragmented fulfillment, or a replenishment category. Interpret it alongside contribution margin, returns, and promotion exposure.
Measure the median and relevant percentiles for days between the first and second orders. This can indicate first-order satisfaction, product suitability, onboarding effectiveness, and repurchase potential.
Analyze it by acquisition source, category, discount, device, and fulfillment experience. A long delay may be normal for a durable product but concerning for replenishment.
Plot repeat purchase, active-customer retention, and revenue or margin retention by months since the first order. Cohort curves show:
Compare days since last purchase with the expected buying cycle. Useful segments include:
Combine recency with frequency, value, margin, and service history. An at-risk high-value customer may justify proactive outreach, while an infrequent, low-margin customer may not.
Revenue-only measures can overstate the value of repeat customers.
A practical calculation is:
CM-CLV = Expected customer revenue − product costs − fulfillment − payment fees − service costs − marketing costs
Depending on the business, also include discounts, refunds, returns, rewards, promotional subsidies, support, shipping, and win-back costs.
CM-CLV is more useful than revenue-only CLV for retention investment, loyalty benefits, and customer prioritization. A frequent purchaser with substantial returns may be less valuable than a less frequent, full-margin customer.
Track full-price, discounted, and promotion-dependent orders. Useful measures include:
The goal is to determine whether incentives create durable behavior or merely shift purchase timing while reducing margin.
Measure both customers lost and revenue or margin lost. Many low-value customers can produce high customer churn but low revenue churn; a few high-value customers can create the opposite risk.
Analyze churn by cohort, category, acquisition source, geography, service history, and program membership. Where discounts and returns vary materially, margin churn may be the most relevant measure.
Share of wallet estimates the proportion of relevant category spending captured by the brand. Inputs may include surveys, benchmarks, panel data, customer purchase estimates, and declared competitor spending.
Interpret it with purchase frequency, switching intent, and brand preference. Regular customers may still allocate most category spending elsewhere.
Net revenue retention captures expansion, contraction, and churn within a cohort. Compare it with customer retention to identify concentration risk. Where discounts and returns vary, track margin retention as well as revenue retention.
Behavior shows what happened; attitudinal measures help explain why.
CSAT measures satisfaction with a purchase, interaction, product, or overall experience. Event-based CSAT is often most actionable after delivery, returns, customer support, product use, service recovery, or loyalty-program interactions.
Link responses to later retention, refunds, contact rates, and repeat purchases.
CES measures how easy a task was, such as checkout, resolving a delivery issue, returning an item, or redeeming a reward.
Pair CES with task completion, abandonment, contact rate, resolution time, and repeat behavior. CES is task-specific, not a universal loyalty score.
Compare pre-purchase expectations with post-purchase perceptions across delivery, quality, availability, personalization, returns, support, and value. Combine comments with operational data to identify whether gaps originate in merchandising, fulfillment, product performance, or recovery.
Track:
Specify a realistic timeframe, such as:
> “How likely are you to purchase from us again within the next 90 days?”
Validate stated intention against second purchases and retention. Intent is a leading indicator, not proof of future behavior.
Measure trust, confidence, belonging, appreciation, attachment, and reassurance with consistent survey items. Link emotional scores to retention, referrals, willingness to pay, and reactions to service failures.
Emotional loyalty is diagnostic rather than a substitute for behavioral evidence. It can explain why customers forgive mistakes, tolerate price differences, or respond to service recovery.
Referral Rate = Customers generating referrals ÷ Active customers × 100
Track the complete path:
Separate incentivized referrals from organic recommendations. Referral volume matters less than incremental margin and referred-customer retention.
Useful measures include:
Average star rating can hide product mix, review volume, and emerging dissatisfaction. Review text can reveal drivers such as reliability and delivery confidence.
Track customer photos, unboxing content, community contributions, and social posts. Evaluate quality, reach, engagement, assisted purchases, and reliably attributed conversion. Activity volume alone is insufficient.
A score may combine meaningful actions such as repeat visits, product usage, email clicks, app sessions, reviews, community participation, and reward redemption.
Weight actions according to their demonstrated relationship with future value rather than assigning equal points. Retain the score only if it predicts retention, margin, or CLV.
Measure more than enrollment:
Passive enrollment is not engagement.
Members may already purchase more frequently, have longer tenure, or show stronger preference before joining. Higher member revenue therefore does not prove that the program caused the difference.
Reward costs can also reduce contribution margin. The key question is:
> Did the program create profitable behavior that would not otherwise have occurred?
Track:
Assess both immediate and long-term effects. A program may increase orders while reducing margin or merely shift purchases earlier.
Use:
Report incremental outcomes, not member-versus-non-member averages alone.
At minimum, segment by:
There is no universal definition of inactivity:
Mark customers at risk when they exceed the expected category buying cycle, not an arbitrary calendar threshold.
Each segment requires a different action. An at-risk high-value customer may need service recovery, while an engaged but infrequent customer may need education rather than a discount.
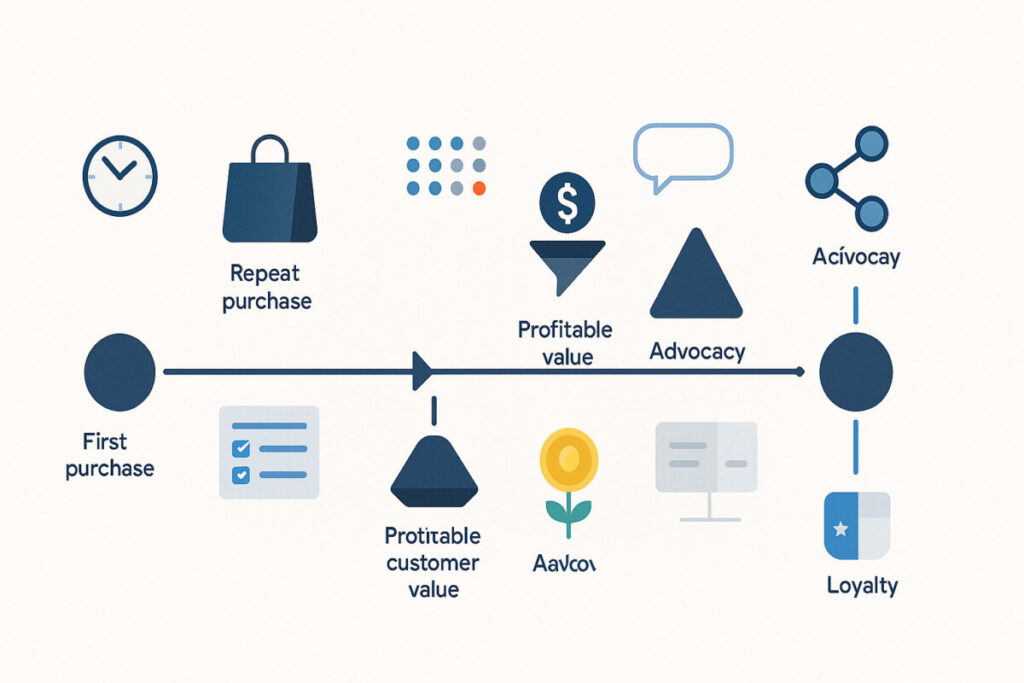
| Metric | Type | Best use | Primary limitation |
|---|---|---|---|
| NPS | Attitudinal, diagnostic | Relationship trend and advocacy | Does not prove retention or profitability |
| Repeat purchase rate | Behavioral | Loyalty and cohort comparison | Sensitive to buying cycle and necessity |
| Retention rate | Behavioral | Churn and lifecycle analysis | Requires a clear inactivity definition |
| Purchase frequency | Behavioral | Cadence and value analysis | Can be promotion- or category-driven |
| Time to second purchase | Behavioral, leading | First-order and onboarding evaluation | Less useful for durable products |
| CM-CLV | Economic | Investment and prioritization | Depends on cost and forecast quality |
| Churn and margin churn | Behavioral/economic | Risk and value protection | Fixed windows can misclassify customers |
| CSAT | Attitudinal | Journey-stage management | Does not necessarily predict behavior |
| CES | Attitudinal | Friction reduction | Task-specific |
| Referral rate | Advocacy | Organic growth | Incentives can distort results |
| Engagement score | Leading | Early risk and activation | Requires validation |
| Program incrementality | Causal/economic | Program investment decisions | Requires controls and sound design |
Relationship
Behavior
Economics
Advocacy
Program
Select one or two primary measures per dimension; use the remainder to diagnose changes.
Define customer, order, refund, and margin rules; observation windows; data sources and owners; survey timing and sampling; response-rate treatment; exclusions; segment definitions; and alert thresholds.
When a metric changes sharply, check data quality, survey mix, product composition, promotions, and operational incidents before acting. Dashboards should support root-cause analysis and cross-functional ownership.
Start with the business decision.
| Business decision | Primary measures | Useful diagnostics |
|---|---|---|
| Improve onboarding | Time to second purchase, second-purchase rate | CSAT, CES, delivery feedback |
| Reduce churn | Retention, recency, margin churn | NPS, service contacts, cancellation reasons |
| Allocate retention budget | CM-CLV, margin retention | Discounts, returns, support cost |
| Improve service recovery | Post-resolution CSAT, future retention | CES, resolution time, verbatims |
| Assess advocacy | Referral rate, referred conversion | NPS, reviews, UGC, preference |
| Evaluate loyalty program | Incremental margin and retention | Redemption, reward cost, matched cohorts |
Use engagement, effort, satisfaction, and repurchase intention as early signals. Use retention, repeat purchases, CLV, and margin as outcome measures. Test their relationships rather than assuming that an attractive leading metric predicts value.
Avoid composite loyalty scores unless weighting is transparent, evidence-based, and stable. A single score can hide trade-offs such as higher engagement alongside lower margin.
Check whether purchases are required, contract-bound, discounted, or difficult to substitute. Add preference, switching behavior, price sensitivity, and advocacy measures.
Include discounts, returns, fulfillment, rewards, payment fees, and service costs. Compare revenue growth with contribution-margin growth.
Align repurchase and churn windows with category behavior. Use cohort curves or survival analysis for irregular purchases.
Standardize timing, channel, wording, and sampling. Report response rates and compare respondents with the wider customer population.
Weight meaningful actions and test whether engagement predicts future retention or CLV.
Member-versus-non-member averages are insufficient. Account for pre-existing differences and report incremental orders, margin, and retention.
Define loyalty outcomes, customer populations, buying-cycle windows, and margin rules. Baseline NPS alongside repeat purchase, retention, and contribution-margin measures. Identify gaps across ecommerce, CRM, service, survey, and loyalty platforms.
Connect customer IDs across:
Create cohort and segment views while applying consent, privacy, and data-governance controls.
Test whether NPS, CSAT, CES, engagement, repurchase intention, and early journey signals predict later behavior. Correlation supports exploration but does not establish causation. Where possible, identify which signals predict profitable retention.
Recalibrate thresholds, weights, and buying-cycle assumptions. Audit survey quality, attribution, and program incrementality at least quarterly. Retire metrics that do not influence decisions or predict meaningful outcomes.
The strongest combination usually includes retention rate, repeat purchase rate, time to second purchase, contribution-margin CLV, CSAT, CES, referrals, and engagement. The right mix depends on the category and decision. Subscriptions may prioritize renewal and cancellation, while durable-goods retailers may emphasize preference, advocacy, and service experience.
Add brand preference, switching behavior, price sensitivity, emotional loyalty, referrals, reviews, and profitable customer value. These distinguish genuine preference from purchases caused by necessity, convenience, contracts, or discounts.
Potential leading indicators include time to second purchase, early engagement, CSAT, CES, repurchase intention, and first-order experience. Validate them against later cohort retention and contribution margin within the relevant category and buying cycle.
Yes. NPS can monitor relationship health, identify advocates and detractors, and support closed-loop feedback. Pair it with transaction, margin, service, and engagement data. It should not be the sole loyalty or program-performance measure.
Match measurement windows to purchase cycles: shorter windows for consumables, seasonal windows for fashion and gifts, renewal milestones for subscriptions, and longer periods for durable goods. Universal churn thresholds can misclassify customers.
Use randomized holdouts where feasible, or matched controls and difference-in-differences otherwise. Compare incremental orders, revenue, retention, frequency, and contribution margin after discounts and reward costs. Member performance alone does not establish impact.
NPS indicates whether customers are willing to recommend an ecommerce brand, but it does not fully measure loyalty, profitability, or future purchasing behavior. A stronger system combines behavioral, economic, attitudinal, advocacy, and engagement data.
Copyright © 2023. YourCX. All rights reserved — Design by Proformat
