

- Research platform
Sources of information
Data analysis
Actions

- Solutions
For whom
Problems / Issues

- Materials
Materials
- About us
About us
The Digital Experience Index (DX) represents a revolutionary measurement framework that transforms how businesses evaluate and optimize their digital touchpoints, providing a single, quantitative metric that captures the complete quality of user experiences across websites and digital platforms. This comprehensive scoring system moves beyond traditional analytics to deliver actionable insights that directly correlate with business outcomes, enabling organizations to make data driven decisions about their digital experience optimization efforts.
This guide covers the new era of digital experience measurement and its role as the key to website optimization through objective, standardized scoring methodologies.
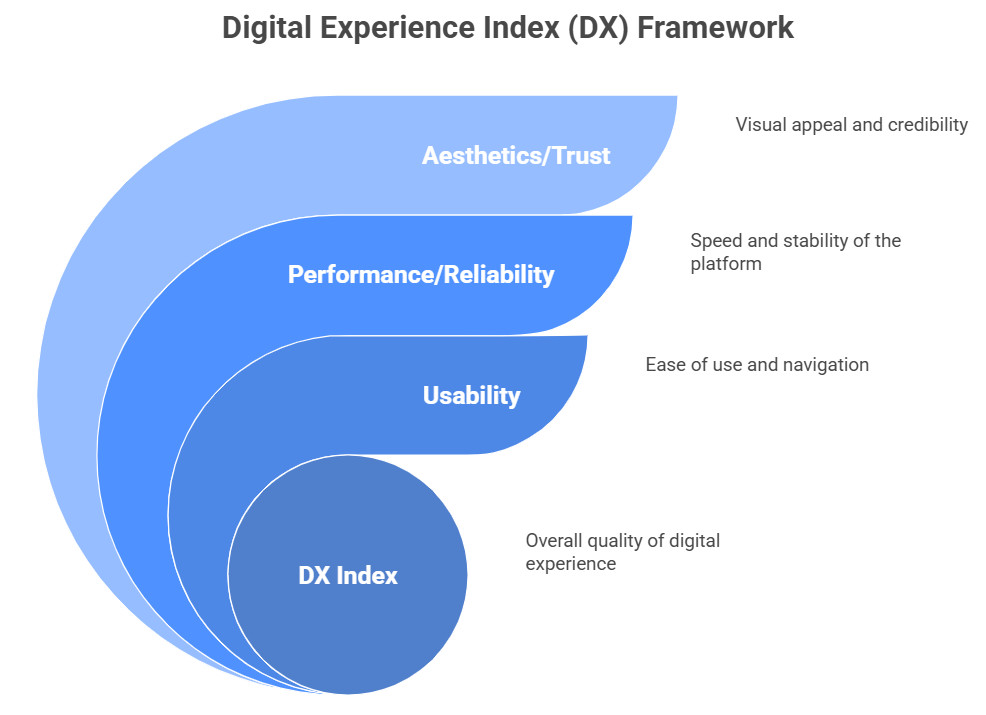
This comprehensive resource explains the Digital Experience Index (DX) methodology and its three core components: Usability, Performance/Reliability, and Aesthetics/Trust. You’ll discover how these factors combine through weighted algorithms to create a unified view of digital experience quality, plus practical implementation using the yourCX tool for automated calculation and detailed insights visualization.
This guide is designed for digital product managers, UX designers, web developers, and business leaders seeking objective measurement frameworks for their optimization efforts. Whether you’re struggling with subjective experience assessments or looking to prioritize development resources based on data driven insights, you’ll find strategies to achieve meaningful improvements in your digital touchpoints.
Traditional digital experience measurement lacks standardization and often relies on fragmented metrics that fail to provide a comprehensive view of user experiences. The DX Index addresses these pain points by delivering a single source of truth that research shows directly correlates with conversion rates, customer loyalty, and business success.
The Digital Experience Index (DX) is a comprehensive, weighted scoring system that quantifies digital experience quality by combining multiple behavioral data points and performance metrics into a single, actionable score ranging from 0-100. Unlike traditional metrics such as conversion rates or bounce rates that measure isolated aspects of user behavior, the DX Index creates a unified view of how users interact with digital platforms across all critical experience dimensions.
The DX Index represents the new era of digital experience measurement because it transforms complex user interactions and customer data into objective insights that businesses can use to optimize their websites systematically. This approach enables cross functional teams to focus their improvement opportunities on areas that deliver the greatest impact on business objectives.
Traditional digital analytics often rely on isolated metrics like page load speed, session duration, or user feedback scores that provide limited insight into the complete customer journey. These fragmented data points fail to capture the complexity of how customers experience digital touchpoints, making it difficult for organizations to identify root causes of poor performance or prioritize optimization efforts effectively.
This connects to optimization because the DX Index provides a comprehensive view that considers the interconnected nature of user experiences, enabling businesses to understand which combination of factors drives customer engagement and business success across their digital platforms.
Research shows that DX Index scores above 80 consistently correlate with superior business performance, including higher conversion rates, increased customer loyalty, and improved user engagement metrics. The statistical validation of the three-component model demonstrates that Usability, Performance/Reliability, and Aesthetics/Trust factors together predict user satisfaction more accurately than any single metric.
Building on conventional analytics, DX Index adds predictive power for optimization decisions by incorporating automation tools that analyze hundreds of behavioral data points to identify friction points and improvement opportunities that directly impact business goals.
Transition: Understanding these foundational concepts leads us to examine how the DX Index calculation methodology transforms multiple data sources into actionable business insights.
The DX Index calculation combines three core components through a sophisticated weighted scoring methodology that analyzes customer interactions, performance data, and user behavior patterns to generate a comprehensive digital experience score. This approach ensures that businesses receive detailed insights about specific areas requiring attention while maintaining a single, unified metric for tracking continuous improvement.
Usability assessment measures navigation clarity, information architecture effectiveness, and task completion efficiency across all digital touchpoints where users interact with your website or mobile apps. This component analyzes user journey patterns, identifies pain points in the customer journey, and evaluates how effectively users can achieve their objectives without experiencing significant friction points.
The usability score incorporates data from session replay analysis, usability testing results, and behavioral data that reveals how customers navigate through different sections of digital platforms. This measurement typically contributes 30-40% weight to the overall DX Index score, depending on business objectives and customer expectations.
Performance and reliability components focus on technical execution metrics including load times, uptime percentages, cross-device compatibility, and system responsiveness across desktop and mobile device experiences. This assessment captures how consistently digital platforms deliver stable, fast experiences that meet customer expectations for modern web performance.
Unlike Usability which focuses on design and navigation effectiveness, Performance measures the technical foundation that enables smooth customer interactions. Data security, mobile app functionality, and website performance across different network conditions all contribute to this component’s scoring algorithm.
Aesthetics and Trust evaluation examines visual design quality, brand consistency, credibility indicators, and security perception factors that influence user confidence and long-term customer loyalty. This component analyzes how professional appearance, trust signals, and design coherence impact user experiences and willingness to engage with digital touchpoints.
Trust elements include security certifications, clear privacy policies, professional visual presentation, and consistent branding that creates personalized experiences aligned with customer expectations. This component typically represents 25-35% of the total DX Index calculation.
Transition: With this calculation framework established, the practical implementation using automated tools becomes the critical factor for organizations seeking to optimize their digital experience strategy.
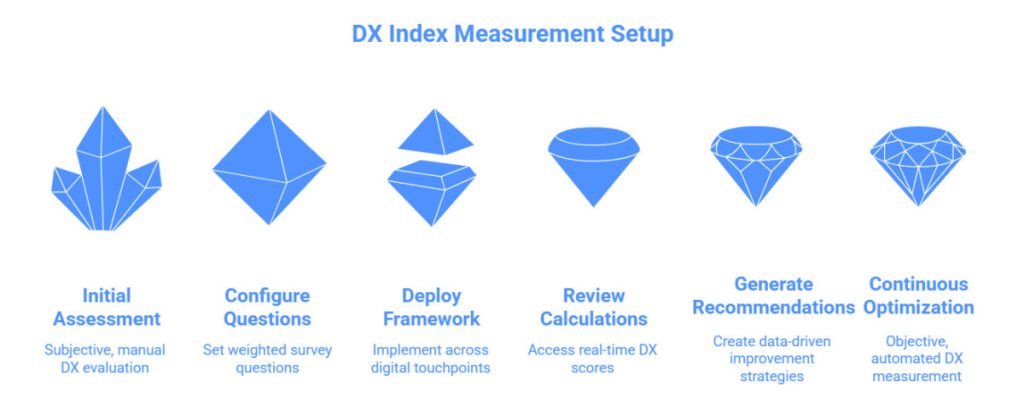
The yourCX tool automates the complex DX Index calculation process by enabling organizations to deploy precise, weighted survey questions that target the three core components while providing real-time visualization of scores and trends. This automation eliminates the significant time and resources typically required for manual digital experience assessment, allowing teams to focus on implementing meaningful improvements rather than data collection and analysis.
The primary value of yourCX lies in its ability to create a single source of comprehensive digital experience data that provides stakeholder buy in through objective, standardized measurement methodologies.
When to use this: Organizations seeking objective digital experience measurement and data driven optimization guidance for their websites and digital platforms.
| Feature | Manual Assessment | YourCX Platform |
|---|---|---|
| Time Required | 4-6 weeks per evaluation cycle | Real-time continuous measurement |
| Accuracy | Subjective, prone to bias | Objective, standardized algorithms |
| Scalability | Limited to small sample sizes | Comprehensive user base coverage |
| Actionable Insights | Generic recommendations | Specific, weighted prioritization |
| ROI Tracking | Difficult to establish causation | Direct correlation with business outcomes |
The yourCX automation delivers superior DX Index implementation by eliminating common challenges associated with subjective assessment while providing continuous insight into how optimization efforts impact overall digital experience quality and business success.
Transition: Even with automated tools, organizations typically encounter specific challenges when implementing comprehensive digital experience measurement strategies.
Organizations implementing DX Index measurement often face obstacles related to subjective assessments, resource prioritization, and demonstrating return on investment for digital experience improvements. These common challenges can significantly impact the effectiveness of optimization efforts if not addressed through systematic, data driven approaches.
Solution: The yourCX tool eliminates bias through standardized, weighted survey methodology and automated calculation that transforms user feedback into objective DX scores. This approach ensures that customer data reflects genuine user experiences rather than internal assumptions or limited sample sizes.
By replacing subjective opinions with comprehensive behavioral data analysis, organizations gain a competitive edge through accurate understanding of what drives customer engagement and satisfaction across their digital touchpoints.
Solution: DX Index component breakdown reveals specific areas requiring attention for maximum business impact, enabling teams to act quickly on improvement opportunities that deliver measurable results. The weighted scoring system provides clear guidance on whether to focus on usability enhancements, performance improvements, or trust-building initiatives.
This systematic prioritization approach helps cross functional teams align their resources with data driven insights rather than competing opinions about which features or improvements should receive attention and investment.
Solution: DX Index correlation with conversion rates, customer loyalty, and engagement metrics provides clear business value measurement that demonstrates the financial impact of optimization investments. Research shows that higher DX scores consistently lead to improved business outcomes across industries and digital platform types.
The direct connection between DX Index improvements and measurable business results enables organizations to secure stakeholder buy in for continuous improvement initiatives and justify resource allocation for digital experience optimization strategies.
Transition: Understanding these solutions positions organizations to implement effective DX Index measurement that drives sustainable business growth.
The Digital Experience Index represents the key to optimizing websites through objective, comprehensive measurement that transforms complex user interactions into actionable business insights. By implementing the three-component methodology focused on Usability, Performance/Reliability, and Aesthetics/Trust, organizations achieve a unified view of digital experience quality that directly correlates with conversion rates, customer loyalty, and long-term business success.
High Digital Experience Index scores enable objective prioritization of development efforts while providing the data driven foundation necessary for continuous improvement across all digital touchpoints.
To get started:
Copyright © 2023. YourCX. All rights reserved — Design by Proformat
