

- Research platform
Sources of information
Data analysis
Actions

- Solutions
For whom
Problems / Issues

- Materials
Materials
- About us
About us
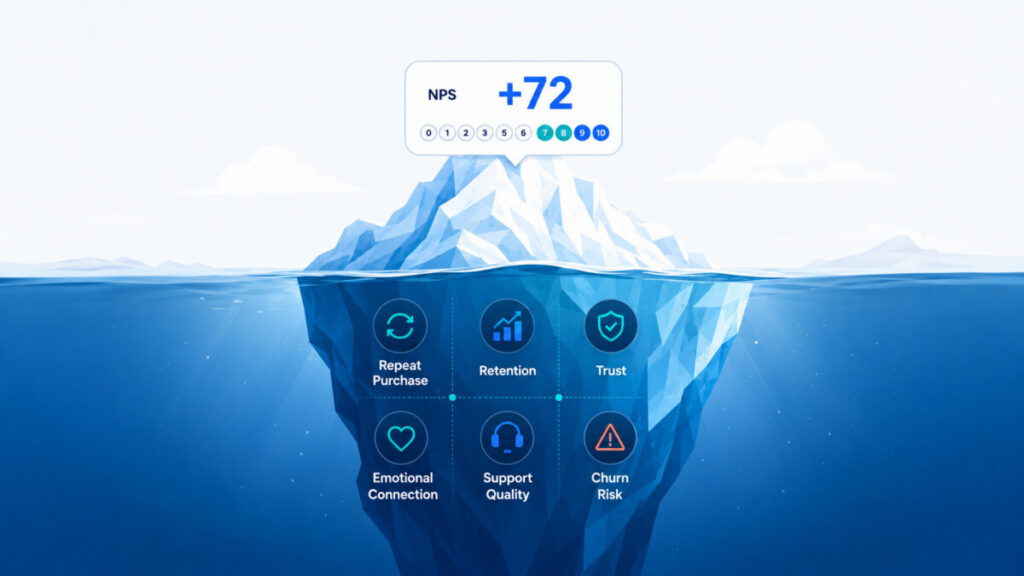
High Net Promoter Score (NPS) numbers are often celebrated as evidence of customer loyalty. The reality? A high NPS impact may indicate short-term satisfaction or recommendation intent, but it does not guarantee loyal behavior. This article unpacks common CX myths that tether NPS to loyalty, clarifying what NPS captures, what it obscures, and why treating it as a loyalty proxy can derail both measurement and strategy.
NPS, or Net Promoter Score, is a familiar metric for most CX leaders. The core survey question is elegant in its simplicity: “How likely are you to recommend our company to a friend or colleague?” Respondents answer on a scale of 0-10, grouping into promoters (9-10), passives (7-8), and detractors (0-6). The score is the percentage of promoters minus detractors.
What NPS does well:
What NPS misses:
The bottom line: NPS spotlights a sliver of the loyalty picture, leaving critical behaviors and emotional dimensions in shadow.
Satisfaction vs. Loyalty: The Behavioral Divide NPS is often interpreted as a satisfaction metric on steroids—if customers say they would recommend us, surely they’re loyal, right? Not quite. Satisfaction (or willingness to recommend) and loyalty (repeat purchase, active retention, protection against churn) are frequently misaligned.
Consider the “promoter paradox.” Customers may recommend a hotel chain after a pleasant stay, yet have little intention of returning—perhaps price, location, or personal needs change. Other times, a customer remains a vocal advocate while quietly reducing spend, shifting categories, or exploring alternatives.
Empirical Gaps Between NPS and Retention Research routinely finds weak or inconsistent correlation between high NPS and actual repeat business, especially in commoditized or price-sensitive markets. A telecom brand, for instance, may post stellar NPS after a shiny product launch, only to see zero impact on annual retention as contracts lapse and churn rises elsewhere in the journey.
When High NPS Masks Defection It’s possible, and common, for someone to recommend a brand ("They’re great!") right up to the moment they find a better deal or a more convenient service. This isn’t hypocrisy—it’s simply the difference between intent and action. Loyalty, in contrast to satisfaction, is sticky. It survives inconvenience, premium prices, or occasional missteps.
The CX world loves simple narratives, but many don’t hold up to scrutiny. Here are the most persistent myths:
Myth 1: All Promoters Are Loyal Being a promoter means you’re likely to recommend, not necessarily that you buy again or resist competitors. Life circumstances, shifting preferences, or even a minor service hiccup can be enough to drive a happy promoter elsewhere.
Myth 2: NPS Is a Standalone Loyalty Metric Despite industry rhetoric, NPS cannot fully predict or explain customer loyalty. It is a starting point—not the finish line—for understanding why customers leave or stay.
Myth 3: High NPS Equals Retention Yet again, correlation fades on close examination. Multiple studies and market observations show that many high-NPS brands see only modest gains (or even losses) in retention, especially when competitors offer greater convenience or innovative alternatives.
Why These Myths Persist:
This culture sustains a blind spot: the dangerous belief that high NPS impact always means loyal customers.
Relying on NPS alone sets the stage for "false positives"—customers who score you well but are emotionally or practically disengaged. Silent churn is especially insidious in subscription businesses or any sector where contract cycles and inertia mask declining commitment. Without behavioral or transactional signals, these churners remain invisible until renewal drops off a cliff.
NPS surveys often fail to link customer support or post-sale resolution with the overall experience they measure. This is a critical oversight. One poor support interaction can undermine months of positive sentiment and turn promoters into detractors. When NPS is measured apart from—and not integrated with—support and service KPIs, it presents a distorted picture.
NPS can suffer from:
These limitations mean NPS impact, on its own, can lull organizations into a false sense of security.
The Distinction: Satisfaction measures how pleased someone is at a specific moment—after a purchase or service interaction. Loyalty, by contrast, is about repeated behavior and enduring attitudes. It withstands competitive offers, inconvenience, and the occasional error.
Scenarios:
The danger comes from treating satisfied customers as safe from churn, when in fact their ongoing business may depend on external variables: pricing, product relevance, or shifting priorities.
Moving Beyond the NPS Monoculture Truly understanding loyalty means embracing measurement diversity—a blend of intent, action, and emotion.
A Multi-Metric Loyalty Measurement Model:
| Dimension | Metric/Source | What It Captures |
|---|---|---|
| Advocacy Intent | NPS | Willingness to recommend |
| Transactional | Retention rate, repeat purchase, upsell frequency | Actual behavior, lifespan |
| Emotional Loyalty | Qual feedback, brand trust, engagement survey | Investment, resistance to churn |
| Service Experience | Support CSAT, ticket closure NPS, FCR (first contact resolution) | Experience at critical touchpoints |
| At-Risk Signals | Churn modeling, declining usage, payment pauses | Early warning, silent churn |
Integrated Voice of Customer (VoC): Open-ended feedback, journey mapping, and root-cause analysis reveal what’s working—and more importantly, where friction is hiding.
Support Impact on Loyalty: Measure loyalty outcomes by tracking service recovery rates, support interaction NPS/CSAT, and issue resolution time. These direct service metrics often have a stronger link to actual behavior than trailing NPS averages.
Emotional Engagement: Use churn interviews, in-depth qualitative work, or sentiment analysis of open feedback. Customers may forgive errors when they feel understood and valued.
Where Teams Go Wrong:
Convenience vs. Actionable Insight: NPS’s power is its simplicity—it tracks easily, benchmarks well, and rallies executive attention. The downside: this simplicity hides actionable details. Multi-metric frameworks require more effort, cost, and analytical rigor, but avoid the false comfort of isolated highs.
Setting Realistic Expectations: NPS is best used as one trendline among several. Its purpose is directional, not definitive—an early warning or reinforcement, not the sole measure of loyalty health.
A strong loyalty measurement system includes:
Practical Tip: If your reporting deck never puts NPS next to retention or behavioral data, revisit your measurement strategy.
Because NPS measures the intent to recommend at a given moment, not the ongoing commitment to purchase or stay. Customers may speak highly of your brand but switch for reasons of convenience, better offers, or shifting priorities.
NPS is one-dimensional: it captures advocacy intent but misses actual customer behavior (retention, repeat purchase), emotional depth, and journey-specific friction. It is also prone to response bias and cannot identify silent churners.
Absolutely. Satisfaction or intent to recommend is not a contract. Many defectors report being satisfied or even enthusiastic prior to switching—often because another brand offered more value, convenience, or innovation.
Supplement NPS with behavioral and support metrics: retention rate, repeat purchase, churn signals, and support experience scores. Layer in qualitative Voice of Customer data to capture emotional engagement and journey-stage pain points.
Ignoring silent churn means losing long-term customers with no early warning. These customers may boost your NPS while re-evaluating competitors or quietly disengaging, leading to sharp, “unexpected” drops in revenue or engagement.
Often, yes. Research and operational data show that empathetic, effective support can recover detractors and cement loyalty more reliably than high survey scores. Support is a moment of truth for customer retention.
Key Takeaways: High NPS impact is only one indicator in a complex landscape of loyalty drivers. Mistaking recommendation intent for real, resilient loyalty is a strategic risk—and a silent invitation to churn. Mature CX teams integrate NPS with retention analysis, transactional metrics, customer support impact, and emotional VoC insights to form a true 360° view.
Treat NPS as a conversation starter, not the final verdict on customer loyalty. Real loyalty is earned—and measured—far beyond a single number.
Copyright © 2023. YourCX. All rights reserved — Design by Proformat
