

- Research platform
Sources of information
Data analysis
Actions

- Solutions
For whom
Problems / Issues

- Materials
Materials
- About us
About us
European retailers face rising customer expectations for seamless shopping experiences—digital, physical, and everywhere in between. Omnichannel analytics connects the dots, unifying customer data across every touchpoint to illuminate the entire customer journey. The result is smarter decisions, frictionless experiences, and a measurable impact on sales and loyalty.
Omnichannel analytics is more than trend-chasing. It's the discipline of mapping real, cross-channel customer behaviors and resolving friction in real time. For European retailers juggling regulatory demand, market diversity, and fast digital shifts, mastering this discipline delivers a durable competitive edge.
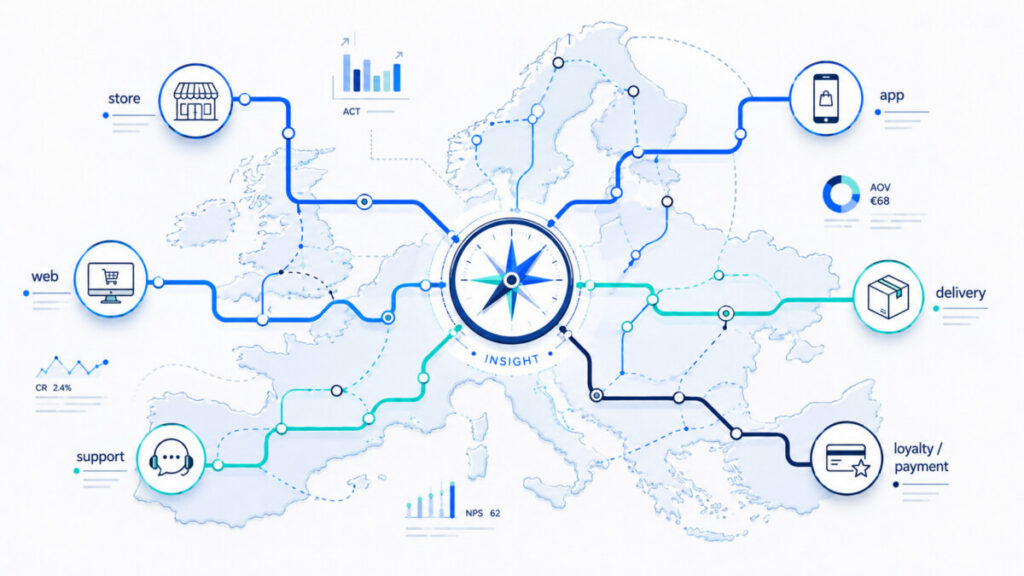
Omnichannel analytics is the systematic integration, analysis, and interpretation of customer data from every available retail channel—physical stores, e-commerce, mobile apps, social media, and customer service centers. Its goal: to provide a comprehensive, dynamic understanding of each customer’s journey, unlocking actionable insights that drive both immediate sales and long-term loyalty.
This is not just an IT exercise. Unlike traditional analytics, which might track channel performance in silos (website traffic, point-of-sale data, or email open rates), omnichannel analytics weaves every data thread into a full customer tapestry.
Multichannel analytics: Typically examines each channel independently. Traditional analytics: Focuses on isolated, historical performance metrics. Omnichannel analytics: Connects every interaction to illuminate sequences, context, and intents—not just outcomes.
Europe’s retail landscape is elastic and fragmented. Cross-border shoppers, localized competitors, and regulatory demands—from GDPR to domestic privacy statutes—pile on complexity. Customer expectations are climbing fast, with consumers moving fluidly from mobile research to high-street browsing to click-and-collect or home delivery.
The only way to deliver and measure seamless experiences across such diverse markets is through omnichannel analytics that can:
Effective omnichannel analytics unifies these inputs into actionable, trustworthy profiles—giving CX and operations teams a shared, real-time understanding.
The first real challenge—and reward—of omnichannel analytics is breaking down data silos to create a true 360° customer view.
Mature European retailers know that cross-channel customer journeys don’t respect internal divisions. A shopper who browses online, picks up in-store, and emails support expects every touchpoint to "know" their context.
A 360° view means stitching event-level data (interactions, preferences, transactions, complaints) into persistent, up-to-date profiles—not just static segments. These profiles drive journey mapping, personalization, and proactive service interventions.
Batch data has lost its edge. The modern European retail environment demands real-time data flows—so in-store staff know if a VIP shopper is coming, support teams see abandoned carts as they happen, and marketing triggers can respond immediately to cross-channel behaviors.
Best practice: Move from legacy batch pipelines to streaming data architectures. Real-time event capture amplifies both operational agility and CX responsiveness.
The value of omnichannel analytics unfolds when it’s used to illuminate—then improve—real customer journeys.
Mapping the customer journey starts with rigorous touchpoint documentation:
Common oversights: Neglecting new channels (like WhatsApp support or Instagram checkout), or failing to track low-intent signals (e.g., wishlists, product comparison clicks).
Analytics tools can bring these journeys to life—not as linear "paths," but as dynamic, branching webs.
Heatmaps, funnel analysis, and path visualizations reveal hidden friction points.
In Europe, segmentation is not optional. Regional regulatory and cultural differences require journey maps to be filtered by market—what works in Germany may frustrate shoppers in Spain or the UK.
For instance, does digital discovery drive more in-store sales in southern Europe, but less in Scandinavia? Only omnichannel analytics can reveal such nuanced, local truths.
True CX improvement comes from root-cause analysis and agile iteration:
High-maturity CX teams implement "walkthroughs as data": combining observed customer journeys with operational analytics and voice-of-customer signals to catch and correct friction fast.
Successful omnichannel analytics is not about collecting data volumes. It's about driving measurable outcomes: higher revenue, smarter operations, and more loyal customers.
Personalized messaging, offers, and content—driven by omnichannel journey signals—deliver higher conversion and engagement, not just in digital but in-store channels as well.
Omnichannel analytics turns CX—and CX improvement—into a business discipline.
The promise of omnichannel analytics is clear. The pitfalls, if ignored, are equally real.
Legacy systems, inconsistent data formats, and organizational fiefdoms create silos that cripple the unified view.
Steps forward:
In some European retail organizations, strong central leadership accelerates this process. In others, cultural barriers slow it down—the difference is often visible in journey mapping fidelity.
Europe’s regulatory environment is complex: GDPR is only the start. Breaches invite severe penalties and brand damage.
Best practices:
Only invest in analytics platforms and partnerships that are proven GDPR-compliant and transparent about their data processing.
No analytics system yields value if teams don’t trust or use it.
Organizational maturity is more decisive than technology breadth. The best European retailers pair technical integration with cultural openness and transparent measurement.
Selecting and rolling out the right omnichannel analytics platform is a journey in itself. The process must balance technical fit, regulatory needs, and real business outcomes.
Capabilities to Assess:
Deployment Stages:
Warning sign: If it takes more than 3-6 months to deliver first wins, the approach is likely too broad or disconnected from operational stakeholders.
| Platform | Integration Scope | Real-Time Analytics | GDPR & Localization | Self-Service BI | Cost Structure |
|---|---|---|---|---|---|
| Platform A | Wide (POS, web, app) | Yes | Strong (multi-EU) | Yes | Usage-based, mid-high |
| Platform B | Moderate | Partial (hourly) | Good (requires setup) | Basic | Seat license, moderate |
| Platform C | Retail specialist | Yes | Very strong | Extensive | Project + usage, high |
| Platform D | API-first | Depends on buildout | Varies by config | Depends | Custom, high flexibility |
Note: Platform selection should factor in not just the technical checkbox, but total cost of ownership, available local support, and reference cases in similar European retail sectors.
Fashion/Apparel: A multi-market fashion retailer integrated online, in-store, and app data to create dynamic customer profiles. They used journey analytics to identify that a large segment frequently browsed via mobile before purchasing during weekend store visits. By triggering app-exclusive offers tied to physical store locations, they increased average spend per customer and improved campaign attribution accuracy.
Grocery: A regional supermarket chain harmonized loyalty, POS, and online order data. Predictive analytics for inventory now flags potential stockouts before they hit, and journey mapping revealed a friction point in online-to-store pick-up, prompting a process redesign. Result: reduced lost-sales apologies and improved NPS among omnichannel customers.
Specialty Retail (Electronics): A chain specializing in consumer electronics deployed unified CRM and service data. Omnichannel journey analysis revealed high-value customers were abandoning purchases after technical support chats. Root-cause analysis led to scripting and escalation changes, slashing drop-offs and boosting follow-up sales.
These examples show sector-specific best practices—start focused, measure rigorously, and feed journey insights back into CX and operational design.
Omnichannel analytics is the process of aggregating and interpreting customer data from all touchpoints—stores, e-commerce, mobile, social, and service—to create a unified, actionable view of the customer journey. It relies on integrated data pipelines and analytics tools to move beyond simple channel metrics and instead track behaviors and outcomes across the full journey.
Typical data sources include POS systems, online browsing, mobile app engagement, social media interactions, and customer service logs. In practice, omnichannel analytics powers journey mapping, personalizes marketing, optimizes inventory, and enables precise measurement of service quality improvements.
By providing a comprehensive, real-time view of customer interactions, omnichannel analytics allows retailers to spot friction points, personalize communications, and proactively refine journeys. This level of insight supports tailored experiences—guiding the right offer to the right individual, at the right time and channel—all while identifying where shoppers drop out or need support. Over time, it strengthens loyalty, NPS, and conversion rates by making experiences feel seamless and intuitive.
The main hurdles include siloed data (divided by channel, region, or department), inconsistent data quality, high costs (especially when retrofitting legacy systems), privacy and compliance challenges, and organizational resistance or data illiteracy. Successful rollouts require strong cross-functional leadership, careful integration planning, and investment in both technology and cultural change.
Start with privacy by design: collect minimum required data, obtain explicit consent, and routinely review datasets for compliance. Use data minimization, anonymization, and robust access controls. Stay up-to-date on GDPR and local rules, and ensure all analytics tools provide clear audit trails and configurability for data subject rights (erasure, corrections, subject access). Partner only with vendors that are fully transparent and established in GDPR compliance.
Early improvements typically appear in campaign ROI (by targeting and segmenting based on journey insights), inventory optimization (reducing out-of-stocks and markdowns), and journey visibility (identifying and removing high-friction points). Even a well-scoped pilot—such as linking abandoned cart data to in-store support workflows—often leads to noticeable uplifts in conversion and customer satisfaction.
Track metrics aligned with both business and CX outcomes:
Effective measurement means integrating both quantitative analytics and Voice of Customer feedback in iterative performance reviews.
With mature omnichannel analytics, European retailers aren’t just collecting more data—they’re mastering the art of CX-driven, insight-powered growth. Unify your channels, map your journeys, and seize the next wave of retail success.
Copyright © 2023. YourCX. All rights reserved — Design by Proformat
