

- Research platform
Sources of information
Data analysis
Actions

- Solutions
For whom
Problems / Issues

- Materials
Materials
- About us
About us
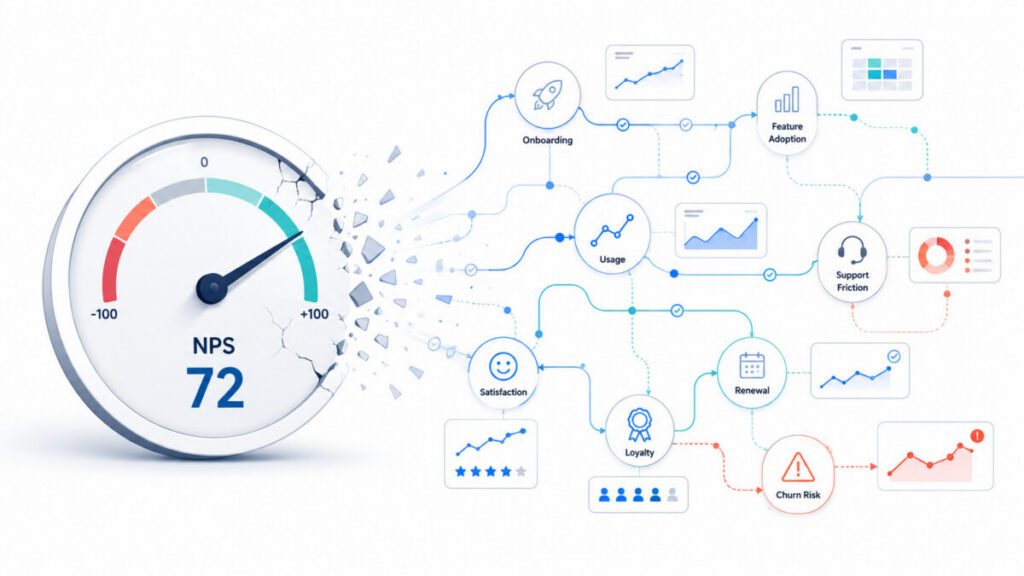
Net Promoter Score (NPS) is a familiar fixture in the SaaS boardroom—but its elegant simplicity belies substantial blindspots. For subscription-driven software, NPS is often overvalued as a catch-all indicator for customer loyalty, growth, and risk. The problem? NPS is a snapshot of sentiment, detached from the complex journey and recurring behaviors that define actual SaaS loyalty. Relying on it in isolation can easily mislead, masking early churn risk, product fit issues, or silent customer flight.
A more credible loyalty model calls for a blend of SaaS-specific metrics: churn analysis, usage signals, revenue retention, and transactional satisfaction. This article critically examines where NPS breaks down in SaaS contexts, then lays out a data-driven alternative—useful for any CX, product, or revenue leader seeking a true picture of customer health.
For SaaS, NPS ignores onboarding, account expansion, and nuanced touchpoint satisfaction.
Customers may recommend your product but quietly leave; only retention metrics reflect this.
CLV, MRR, feature adoption, and ongoing usage expose both advocates and at-risk accounts.
Over-reliance on NPS can mask early churn, and “silent flight,” or growing indifference.
Robust loyalty programs blend NPS with operational, revenue, and satisfaction measures.
_Net Promoter Score_ (NPS) is calculated with a single survey prompt: > “How likely are you to recommend our product to a friend or colleague?”
Respondents score from 0 (not at all likely) to 10 (extremely likely). Companies subtract the percentage of “detractors” (0-6) from that of “promoters” (9-10), ignoring “passives” (7-8), yielding an overall score from -100 to +100.
Why SaaS loves NPS:
But here’s what NPS misses:
NPS is most instructive as a directional, “see something, say something” flag. Its core flaw is that it sheds little light on the _how_ and _why_ behind customer behavior over time.
SaaS doesn’t play by traditional loyalty rules. Its business model relies on continuous value delivery—each renewal is a mini-repurchase decision, shaped by both recent and historical experience. Unlike physical products or one-time services, every interaction, from onboarding to expansion, has outsized influence on retention and account growth.
Key differences in SaaS loyalty:
Relying on periodic NPS surveys can create blindspots at every stage. A user delighted during onboarding may sour after struggling with integrations, while an “at risk” account may never register as a detractor if they simply become unresponsive or leave unannounced.
What’s at stake? Lost expansion opportunities, undiagnosed churn, and wastage in CX investment—misguided by an overly simplistic loyalty lens.
Retention is the most direct indicator of loyalty: do customers stay and renew? In SaaS, the classic annual logo churn rate—percentage of customers lost in a period—reveals overt departures, but much insight comes from _cohort analysis_:
What NPS misses: A promoter can churn due to budget. A detractor may renew because switching costs are high. Hard numbers around churn and retention provide grounding for “why” analysis, not just sentiment snapshots.
Beyond logo counts, true loyalty is often best measured in dollars:
What NPS misses: A SaaS company with rising NPS but stagnant or declining NRR isn’t actually cultivating sticky, expanding accounts—it’s just making people feel good in surveys.
Behavioral data is where SaaS can truly outpace traditional loyalty programs.
Key engagement metrics:
Engagement analytics give _real-time_ insight, sidestepping the lagging signals of annual NPS surveys. For example, a sudden drop in usage in a previously engaged cohort is a churn red flag—even if their last NPS survey was glowing.
While NPS benchmarks relationship health, transactional metrics diagnose loyalty at the _moment of truth_.
CSAT/CES in SaaS:
Blending transactional (CSAT/CES) with relationship (NPS) metrics uncovers journey-stage pain points and gives teams feedback granular enough for targeted improvement.
Moving beyond NPS is less about wholesale replacement than about integration. The most actionable SaaS loyalty frameworks blend leading and lagging indicators, behavioral and attitudinal data, and journey-stage analytics.
| Metric | What It Measures | Strength | Limitation |
|---|---|---|---|
| NPS | Sentiment & referral intent | Relationship baseline | Ignores journey/behavior |
| Retention Rate | % customers retained over X period | Stickiness/loyalty | Masks expansion/contraction |
| Logo/Client Churn | % customers lost | Churn diagnostic | Does not reflect revenue mix |
| CLV | Total value per customer | Long-term profitability | Sensitive to churn estimates |
| MRR/NRR | Monthly/Net Recurring Revenue | Revenue health & growth | Can mask low-margin accounts |
| CSAT | Satisfaction at service moments | Touchpoint health | Not a relationship barometer |
| CES | Customer effort per interaction | Process friction | Needs journey mapping |
| Engagement Score | Product usage & adoption | Early churn warning | Needs robust data integration |
Operationalizing your dashboard:
Periodic Review Checklist:
Set quarterly or monthly cross-team reviews: customer success, sales, product, and analytics must come to the table with their lens on these metrics—not just the survey team.
NPS spikes or dips often correlate with campaigns or product launches—but these are transient. A SaaS company may celebrate a jump in NPS after a feature release while missing the cohort quietly downgrading or churning due to unrelated product gaps.
Weak onboarding or chronically under-used features don’t always drive detractor responses. Those customers may simply never respond (a classic “silent churn” zone) or self-select out before NPS is even measured. NPS rarely flags operational pain before it materializes in lost users.
Customers may not complete NPS surveys, especially if unengaged. Low activity cohorts can disappear with little trace, yet still report neutral or positive NPS if surveyed. Relying on NPS response rates further biases analysis toward vocal, already-engaged users—masking systemic risk.
Aggregated NPS offers little actionable insight. Without segmenting by customer tier (SMB, mid-market, enterprise), lifecycle stage (onboarding, adopted, expanding), or persona (decision-maker vs daily user), you miss the nuanced story: promoters concentrated among one group, major risks in another.
Translation: Without additional metrics, high NPS can breed dangerous complacency—churn creeps in unannounced.
Instead of tracking each metric in isolation, integrate dashboards that display churn, NPS, expansion MRR, and CSAT overlayed across journey stages and customer segments. The goal is to surface leading indicators (like engagement drops) before lagging ones (like churn manifest).
Integrated reporting ensures each team sees both their slice of the loyalty equation and the shared business impact.
Monthly or quarterly loyalty summits (not just periodic CX team check-ins) build a culture where churn is everyone’s problem—and opportunity. Action plans must be tied to movement in these metrics, with root-cause investigation (qual + quant) for any emerging trend.
Good loyalty measurement enables sharp prioritization: Is onboarding CSAT lagging among SMBs? Is NRR sliding because of poor expansion among enterprise? These are actionable signals—a far cry from chasing a “one-score-to-rule-them-all” NPS target.
Ensure metrics stay relevant as product and customer base evolves. As new solutions are adopted, revisit your definitions for “healthy engagement” or “at risk.” Don't let inertia freeze your metrics framework.
Net Promoter Score (NPS) measures customer willingness to recommend a product or service. Customers are asked, “How likely are you to recommend our company to a friend or colleague?” on a 0-10 scale. Scores of 9-10 are “promoters,” 7-8 are “passives,” and 0-6 are “detractors.” NPS = % promoters – % detractors. _Example in SaaS:_ If 60% of respondents are promoters and 10% are detractors, NPS = 50.
NPS only captures sentiment at one moment and often among engaged, vocal users. It overlooks onboarding struggles, feature adoption, silent churn, and revenue contribution patterns that shape true SaaS loyalty.
Complement NPS with:
These together deliver a multi-dimensional loyalty view.
No. While high NPS often correlates with advocacy, it neither guarantees retention nor expansion. True revenue growth follows from sustained product adoption, expansion MRR, and reduced contraction—all areas where NPS alone is silent.
At minimum, key metrics should be reviewed monthly, with cohort and segment breakdowns. CSAT and CES can be monitored in near-real time after touchpoints. Cross-functional metric reviews—tying actions to outcomes—should be quarterly or more often if leading indicators shift.
By grounding loyalty measurement in the realities of SaaS—where renewals are won (or lost) through daily value and evolving product impact—organizations move from chasing survey scores to cultivating actionable retention and growth. NPS isn’t wrong. It’s just one voice in a much richer, and more honest, conversation.
Copyright © 2023. YourCX. All rights reserved — Design by Proformat
