

- Research platform
Sources of information
Data analysis
Actions

- Solutions
For whom
Problems / Issues

- Materials
Materials
- About us
About us
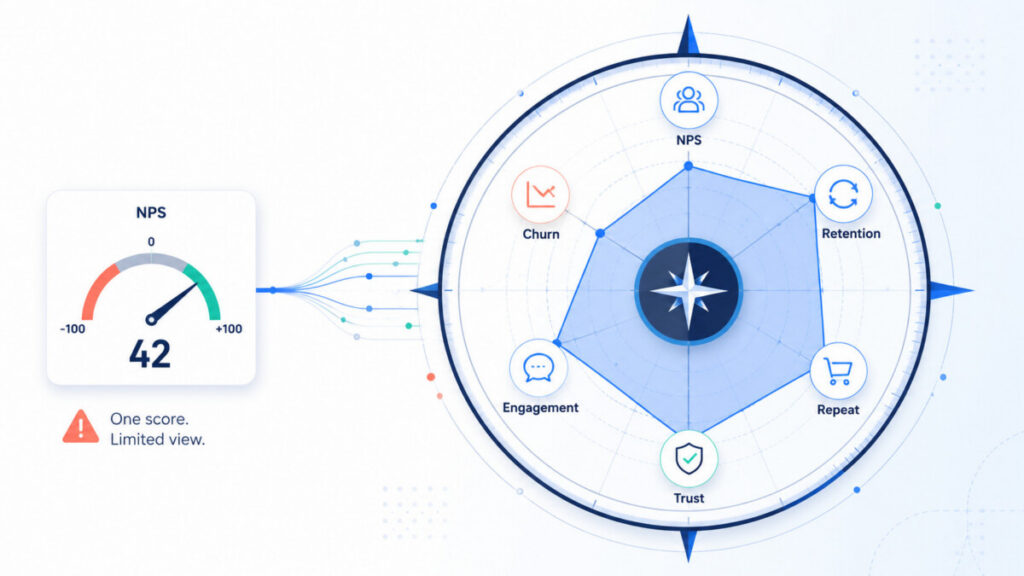
Net Promoter Score (NPS) is widely used as a headline measure of customer loyalty—yet it is too narrow for organizations aiming to truly understand and influence customer retention. NPS indicates how likely a customer is to recommend your brand. What it doesn’t capture are the nuanced behaviors, emotions, and business realities that drive real loyalty and sustained growth. For CX leaders, relying on NPS as the only metric is a strategic blind spot.
Below, we examine the technical limits of NPS, unpack what it misses, and provide a data-informed framework for broadening your CX measurement with more reliable loyalty and retention metrics.
Net Promoter Score emerged in the early 2000s, positioned as a universal CX metric capable of tying customer sentiment to business outcomes. Its appeal is clear: a single, simple question—How likely are you to recommend us?—offering a clear numerical score that’s easy to benchmark and track.
Widespread adoption: Most Fortune 1000 brands now use NPS or a derivative. Its language (“promoters”, “passives”, “detractors”) has become part of the standard CX toolkit. Internally, it’s celebrated for generating executive attention and rallying organizations around a shared goal.
But what does NPS actually measure? At its core, NPS is a self-reported intention. It quantifies the stated likelihood of advocacy, not the act itself. The focus is on sentiment, not outcomes. Customers who score you as a “10” may never actually recommend you or buy again—they may simply have had a pleasant interaction.
This convenience comes at the cost of granularity. NPS misses two critical dimensions:
The result: A high NPS may signal goodwill, but not guarantee loyalty or revenue. For organizations that treat it as the sole barometer of CX health, critical signals are easy to miss.
Treating NPS as the catch-all proxy for loyalty overstates its predictive power. Technically, NPS is a relational or transactional sentiment metric. It is snapshot-based, sensitive to the recency and nature of the customer interaction. When embedded at different customer journey points, the same brand can yield 15-point swings in NPS just based on context—purchase, support, or renewal, for example.
Survey timing introduces additional volatility. A customer’s willingness to recommend may spike after a positive event, then plummet after a minor service lapse—irrespective of their broader relationship.
Academic and commercial studies have repeatedly found that repurchase intention and actual retention or advocacy are only moderately correlated. The causes for this are straightforward:
Key implication: If you operate under the assumption that raising NPS will reliably reduce churn or deepen loyalty, you risk chasing the wrong improvements, investing where it doesn’t count, and missing silent sources of attrition.
To design a comprehensive CX measurement system, expand the lens to include behavioral, satisfaction, and financial impact metrics that fill in NPS’s blind spots.
What it measures: The proportion of customers who remain over a period, typically reported quarterly or annually.
What it measures: Stated likelihood of making another purchase or continuing service.
What it measures: CSAT tracks satisfaction at various customer journey touchpoints, usually via a direct post-interaction survey.
What it measures: The predicted net profit attributed to a customer’s entire future relationship.
What it measures: Depth and breadth of usage—logins, feature adoption, expanded services.
Takeaway: Robust customer experience measurement demands harmonizing survey feedback (like NPS) with operational, behavioral, and financial data.
It’s one thing to report NPS to the board; it’s another to tie customer experience to the numbers that matter—revenue, churn, and growth.
The hard reality: Retained customers are more valuable. They require less marketing overhead, tend to spend more, and cost less to serve over time. Strategic CX teams treat retention as the ultimate KPI—because retention improvement directly feeds into lifetime value and top-line growth.
Data points to consider:
Sophisticated brands set up closed-loop feedback systems that link NPS and other survey results to actual behavioral outcomes:
Conclusion: Real progress in customer experience optimization comes when CX, Finance, and Operations teams share a measurement language—rooted not just in what customers say, but what they do.

A robust CX measurement program triangulates between attitudinal and behavioral data using multiple loyalty metrics—not just NPS.
A mature CX platform does more than collect NPS—it connects every feedback loop to actual business outcomes.
Checklist for Robust CX Measurement:
CX teams, under pressure to show progress, may fixate on improving NPS scores. This can lead to survey fatigue, disconnected improvement initiatives, or, at worst, an internal cynicism—“we get the number, but it doesn’t move our customers.”
Exclusive focus on survey-based sentiment fails to notice:
Without integrating NPS with actual customer journeys and outcomes:
Operationalizing customer loyalty means going beyond the loudest numerical signals to the holistic, often messier reality that drives business performance.
| Metric | What it Measures | Strengths | Limitations | Best Use Cases |
|---|---|---|---|---|
| Net Promoter Score (NPS) | Stated willingness to recommend | Simple, benchmarkable, popular | Intent, not action; subject to bias | Brand-level tracking, trend monitoring |
| Retention Rate | % customers remaining over time | Objective, behavior-based | Lacks sentiment context | Subscription/contract businesses, churn analysis |
| Repurchase Intention | Stated intent to buy again | Forward-looking, segmentable | Not always predictive of action | New product launches, expansion modeling |
| CSAT | Point-in-time satisfaction | Granular, journey-specific | Episodic, lacks loyalty focus | Service recovery, post-interaction surveys |
| Customer Lifetime Value (CLV) | Financial value of relationship | Direct tie to revenue and profit | Requires data maturity, time horizon | Strategic segmentation, resource allocation |
| Usage/Engagement | Product/service adoption | Behavior-driven, indicates stickiness | Needs context for interpretation | B2B SaaS, digital services, upsell risk |
NPS captures customer sentiment but not actual behaviors. It misses contextual and emotional drivers, cannot predict retention with consistency, and is vulnerable to response bias and timing effects.
Metrics such as retention rate, customer satisfaction (CSAT), repurchase intention, customer lifetime value (CLV), and product engagement rates provide a more robust view when used alongside NPS.
Select metrics based on your business model (subscription vs. transactional), product lifecycle stage (launch, growth, retention), and the specific customer journey stages you want to optimize. Align metric selection with core business outcomes, not just survey data.
Improved retention typically reduces acquisition costs, increases average customer value (CLV), and supports more stable, predictable revenue growth. Loyal customers are also more likely to refer, upsell, and advocate, compounding profitability over time.
No single metric, including NPS, fully captures the complexity of customer loyalty. Loyalty is multi-dimensional—requiring an integrated approach that combines attitudinal, behavioral, and financial measures.
Expand beyond NPS, integrating satisfaction, retention, and behavioral data sources. Use analytics tools to correlate insights, close feedback loops, and ensure both operational and strategic teams act on holistic loyalty signals—not just survey numbers.
In sum: Progressive CX teams move beyond the lure of a single, simple metric. Loyalty is not monolithic; it’s a spectrum of attitudes, actions, and emotions that, when measured rigorously, reveal the true levers for business growth. Let NPS be your starting point—but not your finish line.
Copyright © 2023. YourCX. All rights reserved — Design by Proformat
