

- Research platform
Sources of information
Data analysis
Actions

- Solutions
For whom
Problems / Issues

- Materials
Materials
- About us
About us

For e-commerce businesses chasing sustained growth and genuine customer loyalty, Net Promoter Score (NPS) remains a fixture—but it's far from a comprehensive answer. Despite its appeal, NPS cannot fully capture the dynamics of digital retail journeys. Overreliance risks missed signals, misaligned priorities, and ultimately, stalled progress. If your goal is to understand, predict, and influence customer behavior, you need a multi-metric, journey-aware approach that reflects the operational realities and biases inherent in online commerce.
Net Promoter Score has become a default benchmarking tool in online retail, typically deployed as a one-question survey asking: "How likely are you to recommend us to a friend or colleague?" On a scale of 0–10, customers are classified as detractors, passives, or promoters—yielding a straightforward, single-number snapshot of loyalty.
NPS’s simplicity, marketing appeal, and comparability across industries have led to widespread adoption. For e-commerce, it’s often plugged in post-purchase or at periodic intervals as a proxy for overall brand sentiment. The headline metric, and associated verbatim feedback, are easy to socialize among executives.
However, NPS's impact is constrained by three critical operational realities:
The core survey format introduces bias as well. Recall—the ability to honestly report on an experience—fades quickly amid repetitive, non-memorable digital transactions. Survey fatigue further distorts scores in the "passive" and "detractor" ranges, creating an illusion of stability while missing underlying volatility.
E-commerce journeys are inherently high-frequency and fragmented—the average customer persona interacts with platforms via disparate devices, channels, and timeframes. Customers mix and match acquisition channels, compare offers, and utilize personal or guest accounts. This complexity exposes the inherent limitations of NPS as a solitary metric.
Most notably:
From a CX design perspective, this single-data-point paradigm is environmentally unsuited to fast-cycle, omnichannel commerce. The outcome: initiatives aimed at "moving the NPS needle" frequently lag behind, or outright miss, evolving pain points and conversion leakages. The net effect is diminished NPS impact, where measurement becomes ornamental instead of operational.
A modern e-commerce CX program expands far beyond legacy NPS for a full-spectrum view of satisfaction and its operational consequences. Here's how the most critical metrics fit into an intelligent measurement stack.
CSAT distills customer feedback to a simple question: "How satisfied were you with your recent experience?" Instead of a generic loyalty proxy, CSAT pinpoints sentiment at explicit journey moments: checkout, delivery, service interaction, return processing.
Why it matters:
A robust CSAT program, especially with automated in-line surveys, empowers CX teams to connect the dots between operational actions and satisfaction outcomes. It's especially powerful when integrated with ticketing platforms (post-resolution CSAT) or tied to in-app experiences at key conversion points.
CES asks a focused question: "How easy was it to complete your task today?" It exposes the operational root causes that often precede churn—complex navigation, hidden fees, or unhelpful service scripts.
What CES gets right:
In e-commerce, effort scores are invaluable for detecting UX obstacles masked by overall conversion statistics. For instance, a checkout sequence requiring five screens may not kill the sale today but will erode long-term loyalty and encourage opportunistic competitors.
Repeat purchase rate measures the percentage of customers who come back to buy again within a defined period. It's the most direct behavioral signal of satisfaction and trust.
How to use it:
While lagging compared to survey-based measures, RPR serves as a powerful litmus test for the efficacy of your broader satisfaction strategy. If NPS or CSAT is improving but repurchase is flat or declining—your metrics are misaligned with core business outcomes.
CLV estimates the total net margin a customer delivers over their journey—projected from transaction data, retention rates, and average spend. Satisfaction metrics are critical predictors (or lagging explainers) of CLV.
In practice:
CLV links intangible experiences to hard financial outcomes: it is the bridge between "CX is important" and "CX moves the bottom line."
A robust e-commerce satisfaction dashboard does not stop with survey scores or high-level aggregates. Some foundational metrics include:
When tracked in concert with satisfaction/loyalty scores, these metrics spotlight where operational excellence reinforces or undermines CX outcomes.
A metric, in isolation, is merely noise. Actionable insight—what separates successful e-commerce operators—is born from triangulation: aligning what customers say (NPS, CSAT, CES) with what they do (repeat purchases, abandonment, complaints) and how you deliver (operational KPIs).
Closed-loop feedback means more than collecting a score—it demands process discipline:
Suppose post-contact CSAT consistently flags below-target scores following order issues. When mapped against internal support metrics, you discover that resolution times longer than 24 hours correspond with a 20% drop in repeat purchase probability. Here, the metric stack (CSAT + resolution time + repeat purchase) reveals a direct causal line—empowering a focused investment in service automation or staff training, with a built-in predictive logic for ROI.
Designing a dashboard that actually drives business outcomes—not just reporting—requires technical rigor and CX craftsmanship.
Aggregates hide more than they reveal. Segment your dashboard outputs by:
This surfaces friction and opportunity ‘hot spots’—informing whether churn, low satisfaction, or promotion underperformance are systemic or concentrated.
The maturity leap: Use collected data as inputs for predictive models. Data science teams can:
Selecting and combining the right metrics is an iterative and deliberately non-universal process. Use this checklist to anchor your strategy:
| Metric | Measures | Pros | Cons/Trade-Offs | Best Use Case |
|---|---|---|---|---|
| NPS | Willingness to Recommend | Simple, benchmarked | Lacks detail, intention ≠ action | Brand-level loyalty check |
| CSAT | Transaction/Touchpoint Satisfaction | Granular, immediate | Ignores loyalty, can be momentary | UX, post-support, delivery |
| CES | Ease of Experience | Targets friction | Not always correlated with loyalty | Checkout, onboarding, phone/chat |
| Repeat Purchase Rate | Behavioral Loyalty | Direct outcome | Lagging, needs context | Customer retention tracking |
| CLV | Lifetime Value | Business impact | Complex to model | ROI for retention strategy |
| Operational Metrics | Speed, Resolution, Abandonment | Hard business link | Not inherently customer-centric | Journey optimization |
Even with best intentions, CX measurement projects can fall into these traps:
NPS lacks granularity, fails to explain which customer actions drive satisfaction or dissatisfaction, ignores the nuances of multi-channel journeys, and is prone to biases in recall and survey selection. As a result, it cannot predict retention or reveal where to intervene.
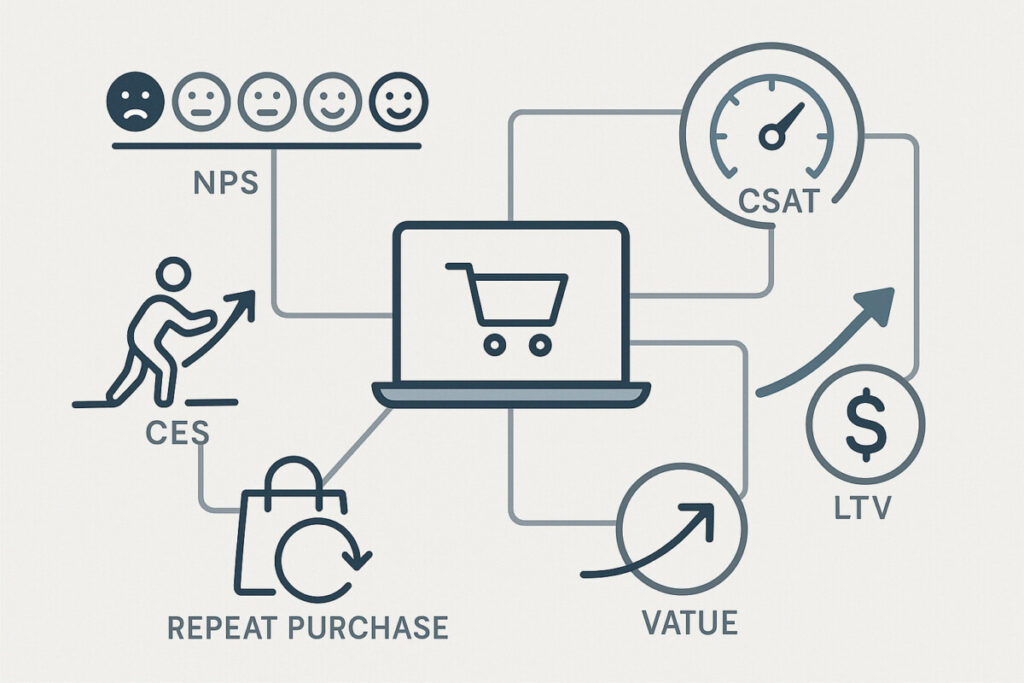
CSAT measures satisfaction at specific interactions, CES quantifies perceived effort, Repeat Purchase Rate captures behavioral loyalty, CLV forecasts business value from satisfaction, and operational metrics (like delivery speed) provide actionable context. Together, they build a multi-dimensional view.
Behavioral data (e.g., repurchase frequency, cart abandonment, issue resolution times) grounds sentiment metrics in real actions. This enables predictive modeling to identify at-risk segments, uncover churn predictors, and connect interventions directly to business outcomes.
Increasing customer satisfaction correlates with higher retention, repeat purchases, greater lifetime value, and lower churn rates. In e-commerce, satisfied customers often become advocates, fueling organic growth while also lowering acquisition costs per net-new customer.
Combine survey metrics (NPS, CSAT, CES) with behavioral and operational data within a unified dashboard. Structure analysis at journey and segment levels, use closed-loop feedback for corrective action, and iterate metric sets in line with evolving business objectives.
Review monthly or quarterly, ensuring fast adaptation to shifting customer expectations, new channels, or feature rollouts. More frequent recalibration may be needed during high-change periods (product launches, holiday peaks, significant UX changes).
E-commerce growth demands more than good intentions and headline metrics. Only a multi-metric, operationally integrated approach reveals the subtle, ever-shifting levers of satisfaction, loyalty, and profitability. NPS is a start, not a strategy.
Copyright © 2023. YourCX. All rights reserved — Design by Proformat
