

- Research platform
Sources of information
Data analysis
Actions

- Solutions
For whom
Problems / Issues

- Materials
Materials
- About us
About us
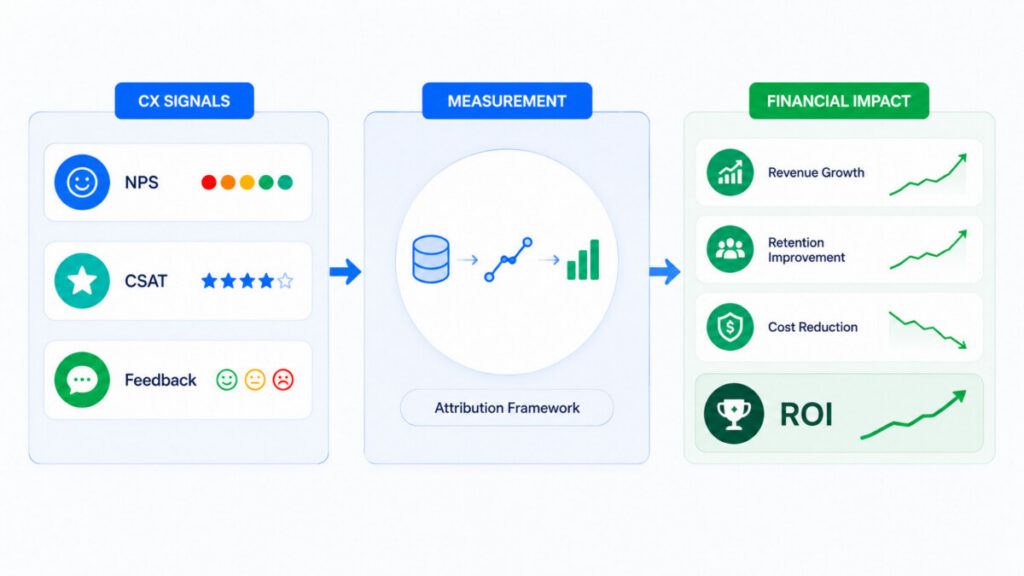
Measuring the ROI of CX—customer experience—demands more than tracking satisfaction scores or collecting anecdotes. For business leaders, the question is not just “Are my customers happy?” but “What is the financial impact of making them happier?” The ability to rigorously link CX initiatives to measurable business outcomes is now table stakes for justifying investment, prioritizing initiatives, and earning executive buy-in.
This article delivers a practical, CX-driven blueprint for quantifying the financial returns of customer experience programs. We integrate advanced measurement frameworks, explain attribution and analytics techniques, and detail the technology platforms and trade-offs involved. The focus: actionable strategies that elevate your CX measurement from soft signals to hard financial results.
The ROI of CX, when defined with business discipline, refers to the measurable financial return generated by improvements in customer experience relative to the resources invested in those improvements. This is not a soft, feel-good measure—executives need hard evidence that investing in journey mapping, service recovery, or VoC analytics meaningfully affects revenue, churn, share-of-wallet, and profitability.
A common misstep: confusing CX operational metrics (like issue resolution times or survey completion rates) with financial outcomes. Operational metrics signal process health, but only customer-centric and financially connected measures signal ROI. For example, a high NPS may reflect intent to recommend, but unless it’s linked to increased purchase frequency, lower churn, or enhanced lifetime value, it remains a disconnected data point.
Measuring the financial impact of CX requires rigor: structured frameworks, agreed-upon KPIs, baseline measurements, ongoing tracking, and governance. The leap from “Is our CX improving?” to “Is CX improvement paying off?” is where many programs stall.
The most credible way to measure the financial impact of CX is by monitoring structured metrics that have a demonstrable link to business outcomes.
Net Promoter Score (NPS): While regularly cited, NPS only predicts financial outcomes when paired with actual purchase or retention data. For instance, tracking the spending behavior or loyalty of promoters vs. detractors yields insights into causality—not just correlation.
Customer Satisfaction (CSAT): CSAT scores are short-term signals that, in isolation, rarely explain financial variance. Their real value comes when CSAT shifts are aligned to operational improvements (like reduced friction points or faster service) and when movement can be tied to actual customer actions—renewals, upsell, or reduced churn.
Customer Effort Score (CES): Simplifying critical interactions (billing, onboarding, support resolution) often reduces churn. Effort scores, analyzed by journey stage, let you pinpoint where friction drives lost revenue.
Customer Lifetime Value (CLV): The gold-standard metric for CX teams seeking ROI proof. Elevated CLV following a CX initiative is a clear financial signal. However, it’s a lagging indicator—requiring long-term analysis and robust data integration.
Retention and Churn Rates: The most direct linkage. If a CX program demonstrably moves the needle on retention—in a way not explained by price or competitive movement—it’s an ROI win.
Metrics must be tracked over extended periods to capture lagging effects, seasonal trends, and multistep journeys. Mature CX programs run true longitudinal studies, not just before-and-after snapshots.
The evolution of CX ROI measurement depends now on integrated data ecosystems, not siloed survey tools or disconnected analytics projects.
Unified Data Platforms: By integrating CX signals (survey data, ticket logs, call transcripts) with CRM systems, loyalty databases, and operational data (shipping times, NPS by touchpoint, purchase frequency), companies build a multidimensional view of the customer journey. Only then does it become feasible to trace revenue shifts or churn spikes back to specific CX interventions.
Modern programs lean on customer data platforms (CDPs) and data lakes, pulling structured VoC, behavioral, and transactional data into unified analytics environments. This integration is the hidden engine differentiating mature CX ROIs from surface-level measurement.
CX attribution is not a single-touch affair. A customer’s experience spans multiple touchpoints and channels, each with varying impacts on spend, loyalty, and lifetime value.
Multi-Touch Attribution Models: These models assign weighted credit to multiple CX interactions across the journey, recognizing that loyalty is seldom sparked by a single stellar moment. Multi-touch models are particularly powerful in B2B or high-consideration B2C markets, where decision cycles involve repeated engagement.
First/Last-Touch Attribution: Simpler, but risky; these models can overemphasize a front-end survey or final support call, missing cumulative experience effects.
AI-Powered Attribution: With machine learning, CX analysts can surface nonlinear, hidden patterns (such as which sequence of touchpoints generates the highest future spend or which combination of journey fixes most reliably decreases churn).
Isolating Causality: Executives rarely invest in “correlations.” The best teams run quasi-experimental designs: A/B testing CX changes in matched markets or customer cohorts, then quantifying revenue deltas using statistical controls.
Knowing that CX is driving up NPS or reducing effort is just a start—business cases demand forecasted, not just historical, ROI.
CX-Influenced Financial Forecasting: Predictive models estimate how incremental improvements in NPS, CSAT, or CES will affect future retention, repeat spend, or cross-sell rates. By modeling, for example, a 10-point lift in NPS as a % increase in CLV, businesses create forward-looking ROI scenarios grounded in real data.
Propensity Modeling: Identify which segments are most likely to respond with profitable behavior if journey friction is reduced. This lets teams prioritize initiatives for maximum financial impact and avoids wasted spend on low-yield segments.
Scenario Planning: Finance and CX teams jointly run “what-if” models to estimate the revenue, cost, or margin effects of major journey changes—launching a new app feature, re-designing an IVR, revamping onboarding.
Many of CX’s strongest financial levers are indirect. Traditional ROI calculations miss these unless advanced analytics brings them to the surface.
Econometric Modeling: By controlling for external variables—market trends, pricing changes, seasonality—econometric analysis isolates the incremental financial return of CX changes. Propensity score matching further refines this by comparing “treated” vs. “untreated” customer cohorts.
The smartest CX teams win executive trust not by “measuring more,” but by connecting CX investment to the company’s strategic north stars.
Every major CX initiative—service redesign, digital transformation, frontline coaching—should be mapped to specific KPIs. These might include:
Use Case Example: A leading technology provider tied its journey mapping overhaul to a target of reducing onboarding churn by 20%, with every onboarding touchpoint improvement tracked for financial yield. Revenue attributed to retained accounts, minus program costs, delivered a net-positive ROI within 18 months—shared in board-level financial terms, not just CX language.

No CX ROI strategy works without robust, integrated technology. The right platform transforms measurement from a manual, reactive process to a continuous, actionable system.
| Capability | Basic Survey Tool | Mid-Tier VoC Suite | Enterprise CX Platform |
|---|---|---|---|
| CRM Integration | No | Partial | Full |
| Multi-Channel Feedback | Email Only | Multi | Omni-channel + Social |
| Real-Time Analytics | Limited | Yes | Advanced, Custom |
| Attribution Modeling | No | Basic | Advanced/AI |
| Closed-Loop Workflow | No | Yes | Yes, Automated |
| Predictive Analytics | No | No | Yes |
| Data Lake/CDP Connectors | No | Occasional | Standard |
The best CX programs are iterative. Static surveys and quarterly reviews no longer pass muster in boardroom conversations about the ROI of CX.
In practice, closing the loop means every voice—promoter, passive, detractor—feeds a living system, where journey owners are accountable not just for satisfaction, but for financial improvement. The feedback process itself becomes an engine for ROI optimization.
Even the most sophisticated CX teams misstep when measurement veers off track.
The discipline: consistently ask, “What will this additional complexity get us—in actionable business terms?”
Start by establishing baseline CX and financial metrics (NPS, retention, CLV, churn). After implementing CX changes, track the same metrics and measure the delta. Use the basic ROI formula: ROI = (Net Financial Benefit from CX Initiative – CX Program Cost) / CX Program Cost. For accuracy, employ attribution models and, where possible, control groups to ensure uplift is due to CX, not confounding variables.
While NPS, CSAT, retention, and referral rates are widely used, the most financial credibility comes from Customer Lifetime Value (CLV), churn/retention metrics, and cross-sell rates, especially when these are tracked at the segment or journey stage level. Referral rates also matter when mapped to reduced acquisition costs.
Yes—integrated CRM and VoC platforms centralize data, support multi-channel feedback, and enable real-time analytics. Advanced platforms feature predictive analytics, attribution engines, and closed-loop operations, all increasing both the speed and precision of ROI measurement. Limitations exist where data silos persist or integration is partial.
The most common mistakes: failing to link CX improvements to financial outcomes, relying on vanity metrics, using incomplete data sources, ignoring indirect benefits (like referrals or cost reduction), and underinvesting in attribution rigor. Another pitfall: treating measurement as a one-off, not a continuous process.
Continuous feedback and real-time analytics are ideal, but formal ROI reviews should occur at least quarterly and following any major CX program rollouts. Responsiveness to business cycles or customer behavior changes is key, as is periodic review of models and metrics for relevance.
Absolutely. Use econometric modeling, propensity score matching, and referral tracking to reveal impacts on cost-to-serve, upsell/cross-sell, advocacy-driven growth, and acquisition costs. Indirect benefits can constitute a significant portion of total CX financial ROI and should not be neglected.
Key Takeaways:
Understanding how to accurately measure the ROI of CX (Customer Experience) programs is essential for demonstrating their financial impact and justifying continued investment. Drawing on best practices and the latest data-driven methodologies, these takeaways will help you link customer experience metrics to tangible business outcomes.
With rigorous frameworks, integrated technology, and practical feedback disciplines, businesses can credibly demonstrate the financial ROI of customer experience—and confidently lead their CX programs from insight to impact.
Copyright © 2023. YourCX. All rights reserved — Design by Proformat
