

- Research platform
Sources of information
Data analysis
Actions

- Solutions
For whom
Problems / Issues

- Materials
Materials
- About us
About us
NPS—the Net Promoter Score—has become the de facto language of customer loyalty in boardrooms and quarterly reports. But a high NPS, while often celebrated, is not a guarantee of lasting customer allegiance. The gap between recommendation intent and actual loyal behavior is larger, and more complex, than the metric’s simplicity lets on.
Effective Customer Experience (CX) leaders know that scoring high on NPS offers at best a partial, sometimes misleading, view of what drives true loyalty. This article examines the myths, exposes common operational pitfalls, and shares a practical approach to feedback analysis that demystifies the link between NPS and genuine customer loyalty.
Net Promoter Score (NPS) was designed as a simple, scalable tool to capture how willing customers are to recommend your company, product, or service to others. Customers respond on a 0–10 scale:
NPS is calculated by subtracting the percentage of detractors from the percentage of promoters, generating a score from -100 to +100.
The metric’s allure comes from its clarity. It promises a pulse on advocacy, supposedly mapping directly to growth. Over the past two decades, NPS has evolved from a research-backed insight into a near-ubiquitous KPI. In many organizations, it shapes incentives, headlines CX dashboards, and informs strategic priorities.
Original intent matters. NPS was meant to surface recommendation intent, not to stand in for all forms of loyalty or satisfaction. Its reach, however, has far exceeded its original design, often creating a false sense of simplicity around highly nuanced customer behavior.
The primary flaw of using NPS as a proxy for lasting customer loyalty is embedded in its one-dimensionality. An NPS survey response is a momentary pulse, shaped by recent interactions, service highlights, or even external mood.
A customer startled by a single problem may give a lower score—even if they rarely consider switching. Conversely, a delighted customer might score you a "10" after a standout touchpoint, yet churn months later due to unrelated factors like product fit or changing needs.
Recommendation intent ≠ loyal behavior. NPS reflects how survey respondents feel, not necessarily how they will act. The intent-action gap, well documented in behavioral research, is especially pronounced in categories with infrequent purchases, complex switching costs, or where social desirability biases influence survey answers.
There’s a growing recognition among mature CX operations: high NPS moments tell an incomplete loyalty story. The underlying commitment, behaviors, and emotional attachments that drive true retention are rarely captured in a one-question survey.
High NPS scores are tempting to take at face value, especially when they trend upward or meet industry benchmarks. But these numbers can gloss over critical, high-risk realities:
CX takeaway: Focusing exclusively on the headline NPS risks missing what keeps customers loyal over time and what pushes them quietly out the door.
Despite its popularity, evidence shows that a high NPS does not reliably equate to actual repeat business or long-term retention. Customers can, and do, recommend brands with which their own future engagement is uncertain or even unlikely.
Why this happens:
CX leaders who chase NPS growth without investigating churn drivers may be blindsided by silent attrition, especially in B2B and industries with complex customer journeys.
Another fallacy: believing that a single aggregate score encapsulates the multidimensional spectrum of customer sentiment.
By reducing complex experiences, emotions, and perceptions to one number, organizations risk:
Over-reliance on NPS can mask golden opportunities—or urgent risks—hidden within richer, messier feedback.
If loyalty were as simple as a number, customer experience management would be easy. In reality, customer loyalty is multifaceted:
Each dimension is shaped by a web of touchpoints—some digital, some human, some invisible. A seamless onboarding, empathetic issue resolution, consistency across regions or channels, and the use of customer data to anticipate needs: these are strong predictors of loyalty but are rarely surfaced purely by NPS.
Take financial services: Many customers will recommend their bank yet switch for better digital experiences or fee models. The mismatch between advocacy intent and behavioral loyalty is a legacy of narrow measurement.
Comprehensive loyalty measurement means mapping how touchpoints, emotional outcomes, and lived behaviors interact over time.
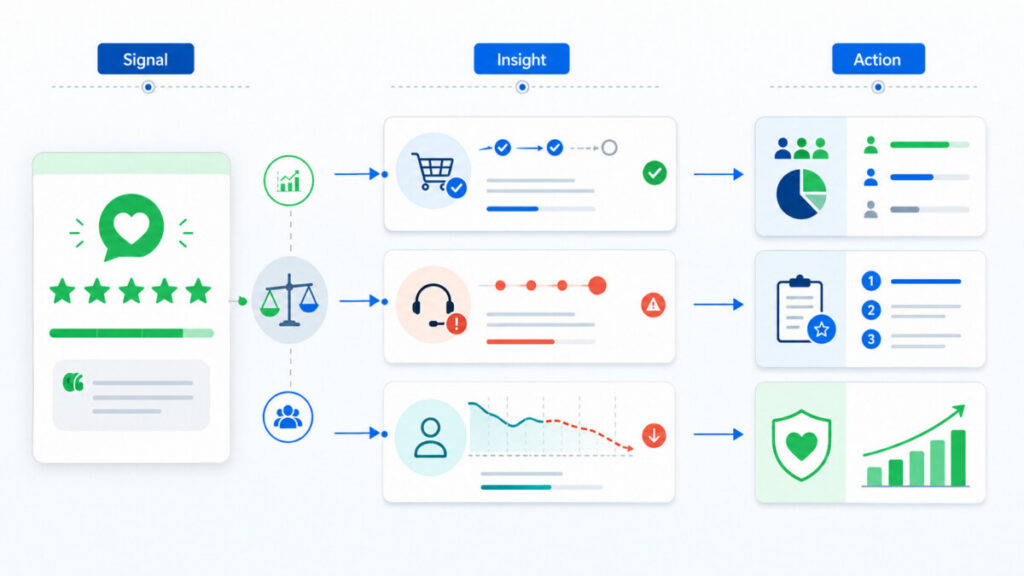
For serious CX organizations, NPS is just an entry point to deeper feedback operations. The richest insights—and most actionable opportunities—emerge when quantitative data is synthesized with the nuance of open-ended feedback.
Why both matter:
Examples of advanced analysis:
Going beyond “How likely are you to recommend?” means asking—and analyzing—what builds trust, where effort can be reduced, and which touchpoints really matter to long-term engagement.
Extracting complex themes is only as valuable as the changes these insights produce. Robust CX programs link feedback analysis to concrete actions:
What works: Operationalizing feedback so that frontline teams, product managers, and executives share ownership over improvement efforts. Velocity matters less than precision; it’s better to move deliberately on the right issues than to chase cosmetic NPS gains.
The cost? False confidence, missed recovery windows, and risk of walking blind into retention crises.
Expert tip: The most effective teams use NPS as a headline—but never a crutch. Their loyalty programs evolve as their customers’ experiences and expectations shift.
A single metric cannot serve as a compass for the entire customer journey. Use this checklist to calibrate a resilient loyalty measurement approach:
| Criteria/Process | Details |
|---|---|
| Metrics Mix | NPS, CSAT, CES, retention/churn data, behavioral analytics, open-ended VoC sources |
| Feedback Cadence | Regular, journey-stage sensitive surveys; periodic cross-channel touchpoint reviews |
| Actionable Reporting | Reports that link themes to operational KPIs; clear assignment of follow-up/responsibility |
| Organizational Ownership | CX team, operations, service, and frontline collaborate; shared incentives, regular reviews |
| Feedback Depth | Thematic, root-cause, and sentiment analysis performed routinely—not only for crisis resolution |
| Predictive Indicators | Continuous correlation with renewal, purchase, and actual advocacy behavior |
| Cross-functional Insight Sharing | Transparent communication channels for sharing findings across product, sales, and support |
| Closed Loop | Mechanisms for notifying customers about changes or improvements based on their feedback |
Signs of an effective loyalty measurement framework:
No. While a high NPS indicates that many customers are willing to recommend your brand, it doesn’t always translate into repeat business or sustained engagement. Advocacy intent at one point in time may not predict future choices, especially if external conditions change or latent issues remain unresolved.
The biggest limitations are its inability to detect hidden churn risks or emerging pain points and its blindness to emotional loyalty, brand affinity, or shifting customer needs. Overreliance on NPS can lead to missed warning signs and misplaced confidence if not complemented by deeper analysis.
Thematic coding, sentiment analysis, and qualitative reviews allow organizations to surface specific reasons for satisfaction or discontent—identifying trends and causal factors that a single score misses. These techniques enable more precise interventions for strengthening customer relationships.
Alongside NPS, use CSAT (Customer Satisfaction), CES (Customer Effort Score), retention and churn analytics, and behavioral data (purchase frequency, engagement rates) for a fuller view of loyalty. Triangulating these metrics helps root out blind spots.
Regularly—at least annually, and whenever there are major shifts in business strategy, customer expectations, or industry dynamics. Business and customer realities don’t stand still; neither should your measurement framework.
Institutionalize a feedback-to-action loop: assign ownership, review feedback in cross-functional teams, connect insights with operational improvements, and communicate back to customers. Effective CX programs ingrain feedback review into daily and strategic decision-making, not as afterthoughts but as core operating rhythms.
Understanding customer loyalty isn't as straightforward as relying solely on a high Net Promoter Score (NPS). While NPS is widely used as an indicator of customer allegiance, this metric can be misleading if considered in isolation. Below are the essential takeaways that deepen your perspective on the real relationship between NPS, customer loyalty, and the myths surrounding customer experience measurement.
These key points will guide you through the nuanced realities behind NPS, debunking common myths and highlighting more comprehensive strategies for cultivating lasting customer loyalty. Let’s explore how a more thorough approach to feedback and measurement can transform your customer experience initiatives.
Copyright © 2023. YourCX. All rights reserved — Design by Proformat
