

- Research platform
Sources of information
Data analysis
Actions

- Solutions
For whom
Problems / Issues

- Materials
Materials
- About us
About us
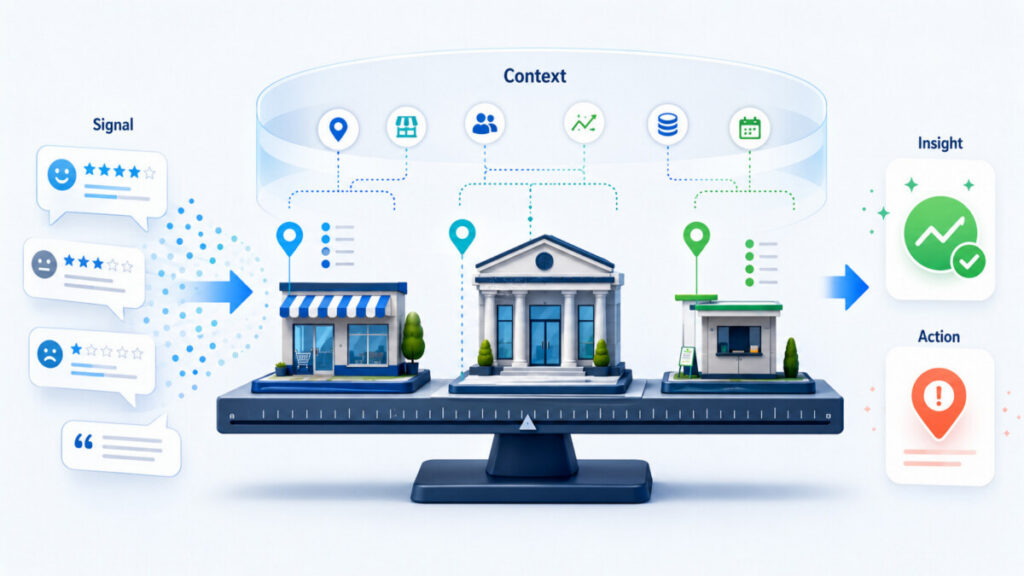
Retail chains, bank branches, insurance offices, telecom stores, and service centers in Poland form extensive networks where customer experiences vary drastically from one location to another. Executive boards and chief operating officers want to know which stores provide the best service quality and where customer dissatisfaction is holding back sales.
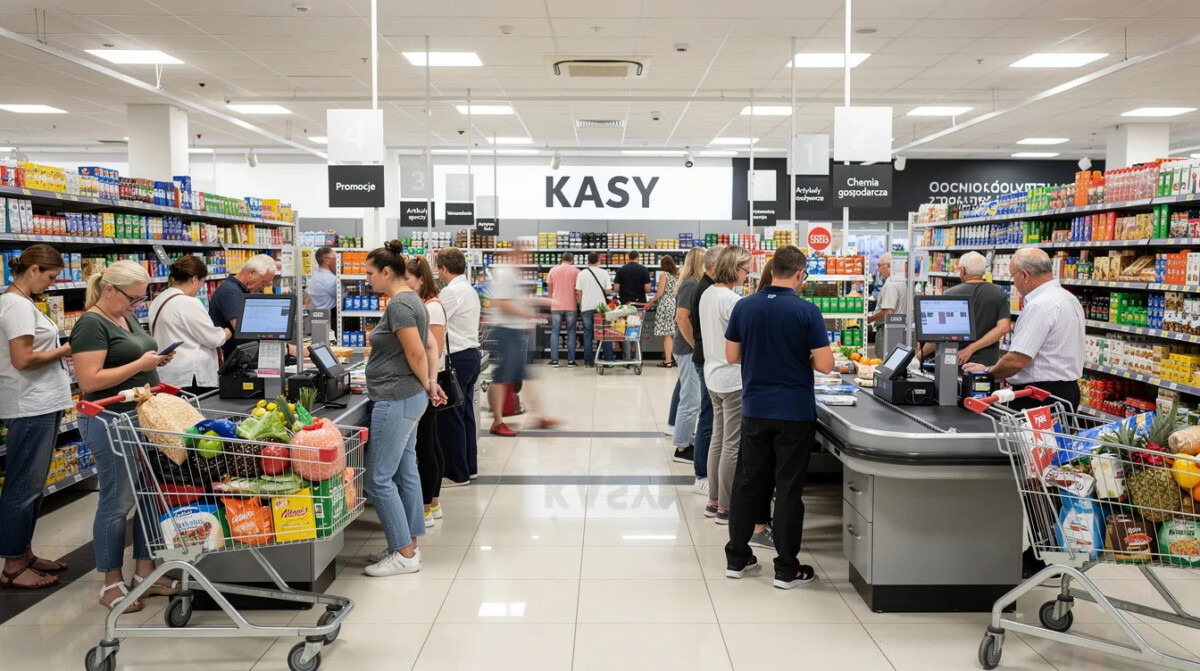
At the same time, consumer behavior is complex. 66% of Poles choose small, local stores close to home, while 36% of Poles shop online at least once a week. This means that the same chains must manage customer experiences across completely different channels and formats simultaneously.
Popular internal rankings like “Top 10 branches by NPS” are tempting, but when approached too simplistically, they often mislead managers and distort the picture. Effective local CX benchmarks aren’t just average metrics in Excel, but a well-thought-out methodology for comparing locations in their real-world context. This article is based on YourCX’s experience analyzing thousands of locations in retail, banking, insurance, and services in Poland.
Local CX benchmarks involve the systematic comparison of customer experiences across specific locations: stores, bank branches, partner locations, or regions. The analysis covers metrics such as NPS, CSAT, CES, service quality, and product quality. For example, the analysis of customer experiences in one of our large-scale research projects was based on over 550,678 ratings collected from multiple locations simultaneously.
A benchmark can be internal (comparing stores within a single chain) or external—for example, comparing results against the Retail & Services CX Benchmark Poland 2026, which includes over 4 million Google Maps reviews for 200 brands.
The main objectives of local CX benchmarks are:
A properly designed benchmark incorporates Voice of Customer (VoC) tools, which are used to gather customer feedback—it is not limited to mere numbers.
Imagine two bank branches: one in downtown Warsaw handles mainly mortgage loans (complex, stressful cases), while the other, in a small town, handles simple deposits and opening savings accounts. The NPS for the first branch is 30, and for the second, 55. Does this mean the manager in Warsaw is performing worse? No—it stems from the nature of the cases.
Factors that distort a simple ranking include:
In regulated industries, customer expectations are also influenced by central decisions, Polish regulations, and the requirements of tax or supervisory authorities, over which a local branch has no control. Transfer pricing regulations vary by region, which can lead to differences in offerings and service processes across regions. Analysis of operational data may include service time and the number of complaints—these factors should be part of the benchmarking context.
A single metric rarely provides the full picture. Basic metrics such as NPS, CSAT, and CES are used to evaluate customer experience—but each serves a different purpose:
In addition to these three metrics, it’s worth tracking:
Quantitative metrics are supplemented by qualitative methods. Mystery Shopping is a method for objectively evaluating service at locations, while In-Depth Interviews (IDI) allow us to understand customer experiences on a deeper level. CAWI surveys are conducted online and serve as a quick channel for collecting feedback after a visit. When comparing results across locations in Poland, the interquartile range is commonly used as a measure of dispersion—it helps distinguish typical values from outliers.
This is a key principle of any fair CX benchmark. Comparing everything to everything else leads to misleading conclusions.
The concept of “fair comparison”: we compare stores in shopping malls with other malls, and visited street-level locations with other street-level stores. 70% of respondents value a well-balanced tenant mix in retail facilities, so a store in an attractive mall with strong neighbors will have completely different foot traffic and customer profiles than a standalone store. At the same time, 62% of respondents choose discount stores for purchases over 100 zł—which means that comparing a discount store to a premium boutique is, by definition, incorrect.
Typical comparison groups in retail chains:
Global benchmarks are beneficial for international groups operating, for example, in countries such as Poland or Hungary, but the data in global benchmarks must be comparable across countries—cultural, regulatory, and market differences require caution. In the local market, segmentation by format, region, volume, and customer profile is the absolute minimum.
Results from 15 surveys per week should not be treated the same as results from 1,500 surveys per quarter. With a very small sample size (5–10 responses per month), a single extremely dissatisfied customer can lower the NPS by several dozen points—and vice versa.
Practical guidelines:
In YourCX analyses in the Customer Service area, a sample size of approximately 100,000 contacts allowed for stable comparisons between locations—branches with a very small number of responses were marked as unreliable. Just as transfer pricing analyses in Poland must be updated every three years, CX data requires regular updates and recalibration of thresholds.
An internal ranking of branches can be motivating, but without context and supporting data, it often leads to labels like “good branch” or “bad branch” and defensive attitudes among managers. Used as a control tool, benchmarking is frustrating—but as a learning tool, it adds value.
A better approach combines several perspectives:
The key questions are “why does this location have this result” and “what can other locations learn from it.” Mature organizations use local CX benchmarks to support managers, share best practices across regions, and build a culture of continuous improvement.
Numbers alone aren’t enough to understand the differences between locations. Customer comments reveal the “why” behind the metrics.
Key areas to track in the Voice of the Customer:
Artificial intelligence analyzes emotions in customer comments, enabling automatic topic tagging and sentiment analysis. This allows you to compare the proportion of negative and positive mentions across similar locations and identify patterns for specific locations. In YourCX, comments are automatically classified and presented to managers in the form of simple problem categories, which facilitates a quick operational response.
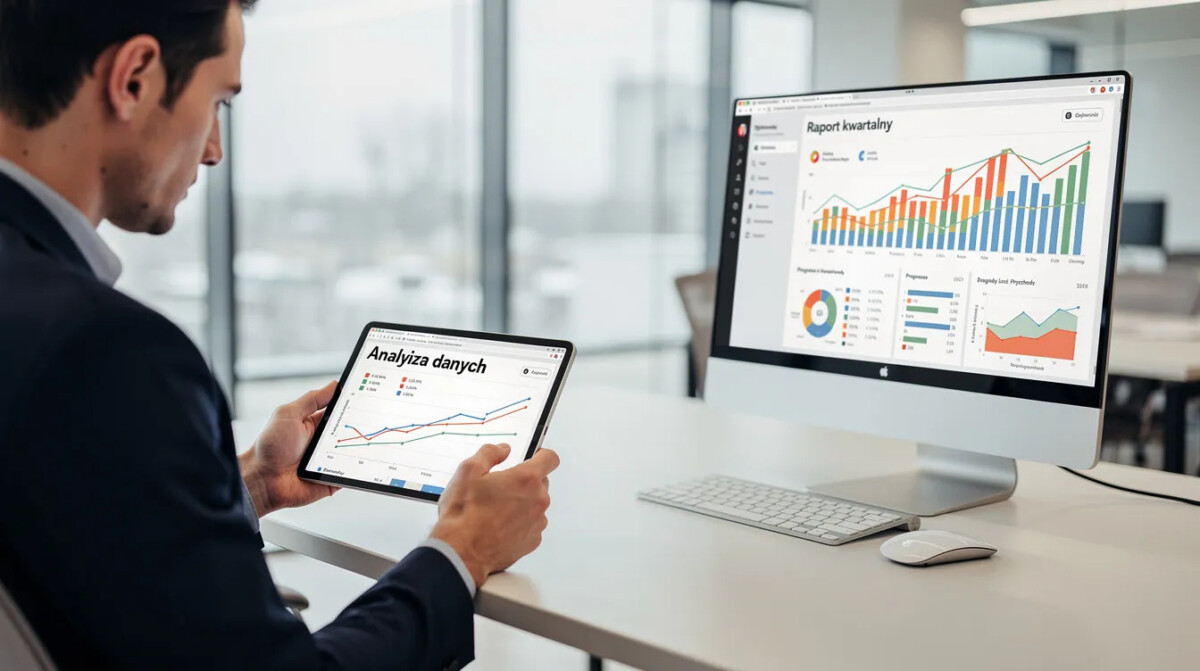
A store or branch manager doesn’t need a table with dozens of metrics without any interpretation. They need clear information: what’s working, what isn’t, and what can be improved.
A good monthly report should include:
Regional reports for chain directors may additionally include a ranking of locations within the segment, a map of regions with color-coded alerts, and identification of exemplary locations. Clear visualizations—trend charts, simple color schemes, alerts—are far more useful than raw data.
Benchmarking only makes sense if it leads to action. Here’s a process that works in practice:
In the case of Multikino, which partners with YourCX, interventions based on the CX survey resulted in an NPS increase of approximately 20 points, and the average rating on Google Maps rose by 0.5. In the Customer Service project, users satisfied with the quality of their interactions achieved conversion rates more than 550% higher.
Modern technology simplifies the creation and management of local CX benchmarks, especially in large chains with dozens or hundreds of locations.
Key capabilities:
All-in-One platforms, such as Birdeye, centralize feedback from multiple channels for multi-location businesses. Research and analytics platforms like YourCX go a step further—they enable the integration of CX data with operational data and the creation of consistent local benchmarks across the entire network, taking into account the specific characteristics of each segment and store format.

Local CX benchmarks are a powerful tool for improving customer experiences and service quality—but only when they are well-designed. A simple compilation of average scores without considering context, a minimum sample size, and comments does not provide an accurate picture and leads to poor decisions.
Companies that treat benchmarking as a tool for growth (rather than merely for monitoring) are better able to translate CX data into operational decisions, increased loyalty, and improved financial results. In a constantly competitive market—where 66% of Poles choose small, local stores, and 62% head to discount stores for larger purchases—understanding the experience at each individual location becomes a competitive advantage.
Before you publish your next NPS ranking online, ask yourself: Do your reports truly help managers understand customer satisfaction and take action—or do they merely “embellish” the results tables?
For most retail and service chains, it’s beneficial to update the benchmark monthly (for day-to-day management) and quarterly (for strategic analysis). In highly volatile industries—such as grocery retail or telecommunications—it’s worth monitoring key metrics as often as weekly, but strategic decisions should be based on longer time frames (3–6 months). Whenever there are major changes to the product or service offering, processes, or regulations (e.g., new requirements from regulatory authorities), it’s a good idea to assess the impact on the customer experience at the local level.
Yes, but this requires segmentation. It’s worth analyzing in-person visits, phone calls, and digital interactions separately—even if they all pertain to the same location. Combining results from different channels into a single metric without breaking them down by contact type makes it harder to identify the source of problems. In local benchmarks, present both the overall result and the results broken down by channel.
A phased approach works best. First, select a few key touchpoints (in-store visit, opening an account, contacting customer service). Next, implement simple CX surveys—for example, a short NPS survey with 2–3 additional questions and an open-ended comment section—and assign feedback to specific locations. Only after several months of collecting data from a sufficient sample size should you establish your first local benchmarks and segmentations to avoid jumping to conclusions.
Yes—combining CX results with data on sales, transaction volume, average order value, and staff turnover significantly increases the value of the benchmark. In practice, YourCX analyzes correlations between NPS/CSAT and operational KPIs, which helps you understand how customer experiences impact business results in specific branches. This approach requires consistent branch identification across CX and operational systems.
Introduce the benchmark along with a clear message that its purpose is to provide support, learning, and the sharing of best practices. Organize workshops where results are discussed collaboratively, with an emphasis on finding solutions. Highlight positive stories—draw attention to locations that have improved their performance by working with CX data, rather than focusing solely on the “worst” locations. When managers see that benchmarking offers them an opportunity for growth—rather than just creating pressure—they begin to view it as an ally.
Copyright © 2023. YourCX. All rights reserved — Design by Proformat
