


- Research platform
Sources of information
Data analysis
Actions

- Solutions
For whom
Problems / Issues

- Materials
Materials
- About us
About us
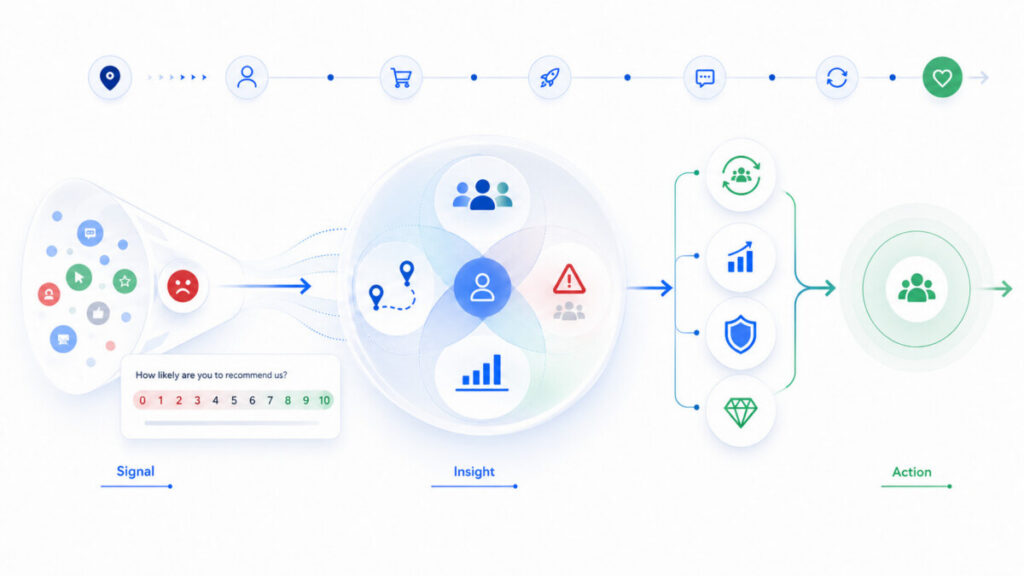
Businesses have long treated Net Promoter Score (NPS) as a proxy for customer loyalty, assuming a rising score necessarily means a stickier, more profitable customer base. The reality is neither this simple nor this reliable. While NPS certainly captures a dimension of advocacy, growing evidence—and decades of practical CX work—undercut the idea that high NPS by itself predicts higher loyalty across all companies, segments, or journeys.
This article directly challenges the commonly held CX assumption that better NPS scores always lead to greater loyalty. Through critical analysis of NPS methodology, an examination of supporting and contradictory data, and a focused look at segment nuances and measurement pitfalls, we clarify where the metric works, where it misleads, and how to build a more multidimensional picture of true loyalty.
The Net Promoter Score, introduced over two decades ago, quickly became ubiquitous in CX circles as the indicator to track. The logic seems straightforward: if customers say they'd recommend you, they're likely to come back—or at least not leave. As a result, companies have celebrated NPS, stacked compensation targets on it, and used it for cross-industry benchmarking.
Yet, the core assumption—higher NPS equals higher loyalty—deserves sharper scrutiny. This is vital for any organization hoping to make truly data-driven decisions about customer satisfaction, retention, and long-term revenue.
It’s time to rethink NPS as a loyalty measure. CX professionals are right to be skeptical. Research doesn’t consistently confirm a direct, causal link, and the lived experience of many service teams is even more nuanced. Advocacy is just one, and not always the most predictive, loyalty signal.
NPS is prized for its simplicity: just one core question, with a scoring system that feeds directly into dashboards, KPIs, and employee incentives.
The standard NPS question:
> "How likely are you to recommend [Company/Product] to a friend or colleague?"
Customers answer on a 0-10 scale. Scoring splits customers into:
NPS is then calculated:
> NPS = % Promoters – % Detractors
This format is attractive. It’s fast, easy to benchmark, and generates a single number for leaderboards and internal targets.
But therein lies its flaw: With reduction comes omission.
Real-world loyalty doesn’t collapse neatly into a single question. Customers often:
NPS mostly surfaces the "willingness to recommend" piece of the loyalty puzzle. This misses:
Example: A high-end SaaS provider might enjoy stellar NPS from IT champions—who recommend the product to peers—but actual renewal rates could lag if procurement or finance teams sour during contract negotiations. NPS doesn’t capture this underlying risk.
A recurring—and often unspoken—problem in NPS-and-loyalty discourse is confusing correlation with causation.
Where NPS performs well: In industries with frequent, transactional touchpoints (think streaming services or quick-service restaurants), studies often show positive links between high NPS and better retention or spend. Here, a promoter is usually an active, happy repeat customer—at least for the time being.
Where the relationship breaks down:
Meta-analyses and academic reviews consistently find that while NPS is “directionally related” to positive customer behaviors, it’s rarely the single best predictor of actual retention, repurchase, or lifetime value. These results reflect both the complexity of loyalty and the impact of contextual variables NPS is blind to.
Not all NPS programs are created equal—or operate in equally predictive environments.
High-frequency, low-consideration businesses:
Low-frequency, high-investment industries:
Segment caveats: Demographics, product portfolios, and lifecycle stage introduce further noise. Early adopters tend to score higher and be more vocal, while long-tenured segments may stabilize at lower but more reliable loyalty rates.
> Key takeaway: NPS is most actionable when interpreted relative to journey frequency, segment profile, and underlying customer behavior patterns.
Generalizing NPS as a universal loyalty gauge sets organizations up for classic measurement failures—and sometimes costly missteps.
Customer feedback data is, by nature, self-selected. Many NPS programs reach only a subset of the customer base, and within that subset, highly polarized opinions are overrepresented.
Critical blind spots:
The NPS question measures intent ("would you recommend?"), not actual advocacy or repurchase. This is a subtle but critical difference.
Word-of-mouth metrics: Attempts to directly link NPS with actual referrals or new business often fall flat without triangulation with hard operational data (referral codes, usage logs, etc.).
Despite its potential, mismanaging NPS programs is routine:
If the goal is resilient, revenue-linked customer loyalty, NPS must be just one component in a broader measurement strategy.
Below is a practical comparison of common loyalty measures, their strengths, weaknesses, and ideal context for use.
| Metric | What It Captures | Data Source | Best For | Limitations |
|---|---|---|---|---|
| NPS | Intent to recommend | Survey (single Q) | Benchmarking, pulse | Ignores retention, usage, depth |
| Retention rate | % of customers returning | Operational | Actual loyalty | Lagging, no motive insight |
| Churn rate | % of customers lost | Operational | Risk tracking | Lagging, does not explain why |
| Customer Lifetime Value (CLV) | Revenue potential per customer | Modeled (ops + $) | Strategic planning | Complex, needs journey context |
| Trust index | Customer trust/confidence | Multi-item survey | B2B, services | Subjective, not action-linked |
| Frequency of purchase/use | Engagement depth | Transactional data | Usage-driven sectors | Misses emotional loyalty |
| Customer Effort Score (CES) | Perceived task ease | Survey | Post-support, onboarding | Focused, not broad |
| Cross-sell/upsell rate | Willingness to expand relationship | Operational | Maturity tracking | Skews towards active customers |
Checklist for modern loyalty measurement:
Practical integration steps:
Best practice: Top organizations embed loyalty measurement across functions, combining Voice of Customer insights with journey mapping, operational monitoring, and closed-loop feedback—ensuring no critical driver gets overlooked.
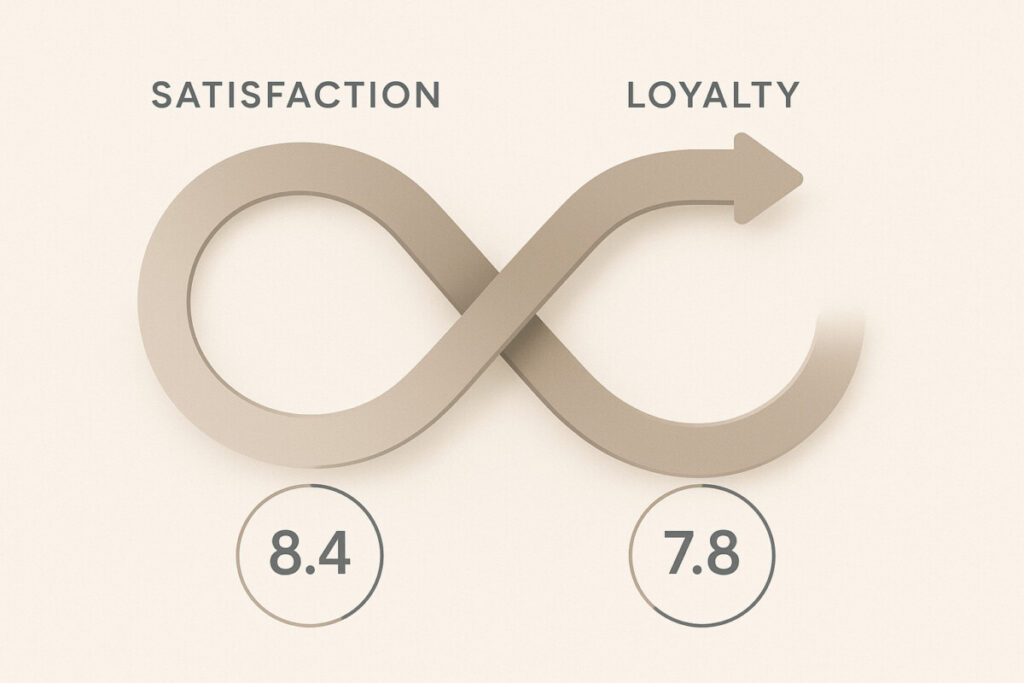
Understanding the real impact of Net Promoter Score (NPS) on customer loyalty has become a critical discussion point in customer experience (CX) strategy. While NPS is commonly used as a key indicator for customer retention and advocacy, the assumption that higher NPS guarantees greater loyalty deserves closer, data-driven scrutiny. Here are the pivotal takeaways from the latest research and analysis.
While NPS can provide valuable directional insights, an overreliance on this single metric risks oversimplifying the complex drivers of customer loyalty. Forward-thinking CX leaders will challenge assumptions, leverage richer analytics, and adapt measurement frameworks to their challenges, segment, and sector.
No. While a higher NPS can indicate greater advocacy, it does not always equate to actual repeat business, longer tenure, or revenue. The correlation varies widely by industry, segment, and journey stage. Infrequent-purchase sectors, complex B2B relationships, and markets with high switching friction especially show disconnects between NPS and real loyalty.
Key criticisms include: its overreliance on a single question, vulnerability to selection and response bias, inability to capture emotional or behavioral loyalty dimensions, and its frequent misinterpretation as a direct driver (rather than loose correlate) of retention or repurchase.
Industry context is central. In transactional, high-touch industries (e.g., streaming, hospitality), NPS changes often precede actual churn or spend shifts. In low-frequency, high-inertia sectors (e.g., automotive, utilities), NPS is less predictive, and should be paired with contract renewal or customer effort data to form a balanced view.
Best-in-class loyalty measurement blends NPS with:
These provide a mix of behavioral, emotional, and financial perspectives.
No. While improving NPS may signal stronger advocacy or satisfaction, sustainable business growth depends on translating this advocacy into measurable retention, expanded share of wallet, and increased lifetime value. This requires operational improvements, segment tuning, and multi-metric monitoring—not NPS in isolation.
Copyright © 2023. YourCX. All rights reserved — Design by Proformat
