

- Research platform
Sources of information
Data analysis
Actions

- Solutions
For whom
Problems / Issues

- Materials
Materials
- About us
About us
The rating scale in a survey is a methodological decision that directly impacts the quality of the collected data, its interpretation, and its business value. Before designing your next CX survey, consider the following guidelines.
The rating scale in a survey is not just a minor detail of the form. It is an element that influences how customers respond, what the distribution of results looks like, whether segmentation is possible, and how accurate business decisions based on this data will be.
Imagine this scenario: an e-commerce team measures CSAT on a 1–5 scale on the website, while the call center uses a 0–10 scale after a phone call. Comparing results across channels becomes unreliable. Management sees different numbers, doesn’t know whether phone support is better or worse, and the analyst wastes time on adjustments instead of taking action.
The wrong scale leads to misleading averages, false trends, distorted results, and reporting issues. This article answers the question: which rating scale to choose—5, 7, 10, or 11 points—depending on the survey’s objective, metrics, and channel.
A rating scale is an ordered set of responses that translates the respondent’s subjective experience—satisfaction, effort, loyalty—into numerical data. This enables analysis, comparison of results, and operational decision-making.
In survey research, we distinguish between different types of scales. A nominal scale has no natural order of values (e.g., selecting a product category). An ordinal scale allows values to be ordered but does not measure the differences between them. An interval scale enables the calculation of differences between values—most rating-type survey questions are based on this scale. A ratio scale has a natural zero point and allows for all mathematical operations, but it rarely appears in opinion surveys. A separate type is the dichotomous scale (yes/no), as well as the semantic scale, including the semantic differential, where the respondent evaluates a given topic on a continuum between two opposing adjectives.
In practice, CX uses numerical scales (e.g., 1–5, 1–7, 0–10), descriptive (e.g., “very bad” – “very good”), and mixed (numbers and verbal labels). Example of a 1–5 CSAT question: “How would you rate the quality of chat support?”. CES 1–7: “How easy was it to resolve your issue?” NPS 0–10: “How likely are you to recommend our company to friends?” Process rating 1–10: “How would you rate the overall online shopping experience?”
The number of points alone is not enough—the labels for the extremes, the presence of a neutral point, and consistency with other questions in the survey are equally important. Multiple-choice questions or closed-ended questions with a single answer follow different rules than rating scales.
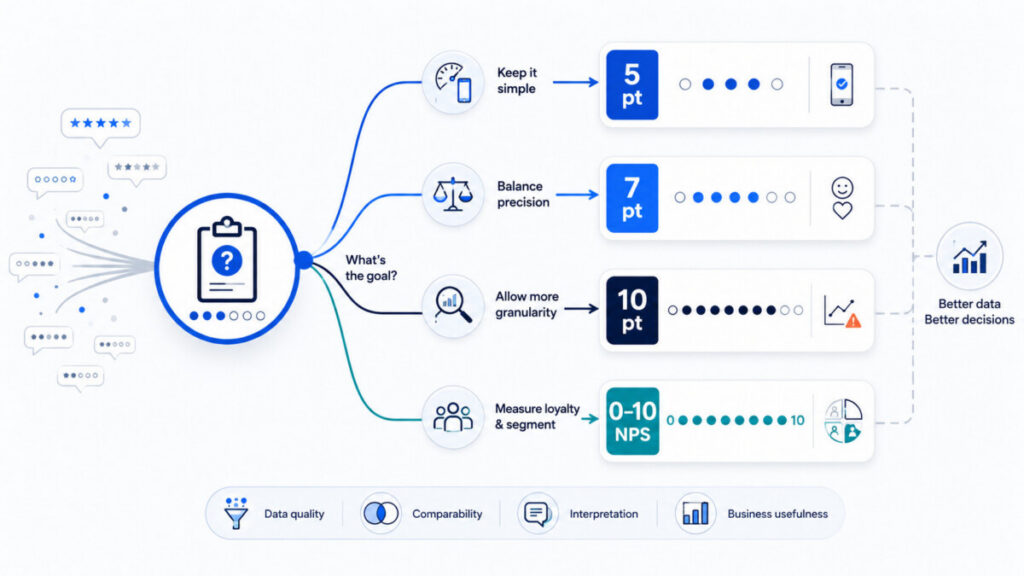
The choice of scale in a survey depends on the research objective—this is a rule worth starting with when designing any CX survey. Below you’ll find criteria to consider before selecting the appropriate scale.
There is no single universal scale. The same organization may use a 0–10 scale for NPS and a 1–5 scale for transactional CSAT questions.
The 5-point scale is the most intuitive and quickest to understand. For this reason, it is often called the “gold standard” in research—the 5-point scale is the gold standard especially where response rate and simplicity are priorities.
Advantages: low cognitive load, well-suited for small screens and short surveys. Easy communication of results (e.g., percentage of 4–5 ratings). Widespread acceptance among customers with varying levels of digital experience. Simple surveys are more likely to yield reliable responses. Works well in transactional research: post-purchase CSAT, post-customer service interaction, post-delivery.
Limitations: less detail than a 7-point scale. Greater concentration of results in the highest categories (4–5), making it harder to detect subtle changes. A scale that is too short limits the expression of nuanced opinions. Potential for blurring differences between segments (e.g., new vs. regular customers).
Examples: “How would you rate the delivery time of your order?” (1–5: very poor – very good). “How satisfied are you with how your issue was resolved by the hotline?” (1–5). “How would you rate the clarity of information on the product page?” (1–5).
The 7-point scale offers greater resolution than the 5-point scale, while remaining acceptably simple. The 7-point scale captures more subtle differences in opinions, which is essential for analyzing segments and trends.
Applications: UX research (evaluation of forms, shopping carts, customer dashboards), brand attitude surveys, measuring Customer Effort Score (CES) on a 1–7 scale in SaaS services, periodic relationship surveys in B2B, as well as in the context of usability testing.
Advantages: better differentiation of responses—the ability to capture nuances (e.g., responses such as “somewhat satisfied” vs. “very satisfied”). Greater precision in segmentation (loyalty scoring, churn risk groups). A study by Altuna & Arslan showed that the dimensional structure of the scale (factor analysis) was better suited to a 7-point scale.
Limitations: requires careful description of the extreme values and the midpoint. In very short transactional surveys, it may be perceived as “too detailed.” In channels with very short attention spans (SMS, push notifications), it may lower the response rate.
Examples: CES: “To what extent do you agree with the statement: ‘Resolving this issue required little effort on my part’?” (1–7: strongly disagree – strongly agree). UX: “How would you rate the ease of finding information about returns on the website?” (1–7).
The 10-point scale (1–10) is a popular choice because it seems “precise” and familiar. The 1–10 scale is often associated with school grading, which gives respondents a sense of intuitiveness, but in CX it creates interpretation issues.
Advantages: a high number of possible ratings, attractive when presenting averages (e.g., 8.4/10). It can be useful in one-off studies, such as when evaluating a new product.
Limitations: lack of a natural midpoint (the point “between” 5 and 6 is counterintuitive). Difficult to interpret—does the difference between a 7 and an 8 in a respondent’s rating represent a real change in experience? High risk of differing response styles across cultures. Too many options can lower data quality. A scale that is too long can be difficult to interpret. A study by Dawes (2008) showed that means on a 10-point scale are statistically lower than those rescaled from 5- and 7-point scales—the difference was approximately 0.3 points.
A 10-point scale may make sense in internal surveys with established interpretation standards or as an auxiliary scale in relational research. Unless there are strong historical reasons, it is better to consider a 5- or 7-point scale.
The 0–10 scale is the standard in NPS surveys. The classic Net Promoter Score uses 11 possible responses and serves as the basis for measuring customer loyalty worldwide.
Customer segmentation in NPS: 0–6 are detractors (critics), 7–8 are passives, 9–10 are promoters. Formula: NPS = % of promoters – % of detractors.
The difference between NPS and a standard 0–10 rating: NPS is a specific question about the likelihood of recommendation, a specific segmentation, and a specific calculation method. A simple average of 0–10 responses is not NPS and does not provide comparable metrics.
Advantages: industry standard—easy comparison of results with other companies and markets. Clear segmentation of customers into groups useful for retention campaigns. Works well with the open-ended question “What is the main reason for this rating?”
Limitations: NPS does not directly measure satisfaction with a single interaction. The NPS number alone does not explain “what to improve”—it requires additional questions and analysis of comments. With a small sample size, it can be highly variable. A study by Menold & Toepoel (2024) showed that on mobile devices, the 11-point scale is fully visible in only about 59% of cases, compared to 99% for the 5-point scale.
The Likert scale was developed in 1932 by Rensis Likert, an American psychologist—the name comes from its creator, Rensis Likert. It is one of the most popular tools for measuring attitudes and opinions in social research. The Likert scale is the most commonly used scale in social research, including marketing research, opinion polls, and for thesis projects.
The respondent indicates the degree to which they agree with a given statement—e.g., “The purchasing process was simple for me.” A typical Likert scale has 5 or 7 response options: ranging from “strongly disagree” through “no opinion / somewhat agree” (I somewhat agree) to “strongly agree” (strongly agree, agree strongly). Variants of the Likert scale include 5- and 7-point versions, and the Likert scale may have a neutral option in the middle of the scale (e.g., “I don’t know, I somewhat agree” → “I somewhat agree”).
Applications: brand attitude research (trust, recommendation), UX research (ease of use, message comprehension), assessment of customer attitudes and beliefs, and customer experience surveys.
The Likert scale allows for statistical analysis of survey data and is used to measure attitudes and opinions. The Likert scale is a popular tool in social research, but not every numerical scale is a Likert scale—the Likert scale pertains to agreement with statements, not arbitrary ratings. It is worth using when combining multiple questions into an index and analyzing it over time. The respondent should clearly understand what each level means.
The issue of a neutral point is a common dilemma when designing a good survey.
Odd-numbered scales (5, 7) offer the middle option as a “neutral” response. Neutral points are desirable in odd-numbered scales. Even-numbered scales (4, 6) force a directional choice—somewhat positive or somewhat negative.
When a neutral point is needed: when asking about an attitude and the respondent may genuinely “have no opinion”; in relational research (e.g., early stages of brand engagement); for sensitive questions, where forcing an opinion increases the risk of random responses. The absence of a neutral option may force false choices.
When it can be omitted: regarding a specific experience just experienced (e.g., immediately after interacting with staff); when the goal is an operational decision (e.g., identifying dissatisfied customers); in very short surveys.
There is a risk of overusing neutral responses—this is the phenomenon of the central tendency bias. It can be counteracted with clear questions, avoiding overly general issues, and adding a “not applicable” option instead of the midpoint of the scale.
A well-designed scale should be unambiguous and symmetrical—this is crucial. Numbers alone are ambiguous, which is why labels are the foundation of consistent interpretation.
Three approaches to labels:
Labels tailored to metrics: CES 1–7: 1 = very difficult, 7 = very easy. CSAT 1–5: 1 = very dissatisfied, 5 = very satisfied. NPS 0–10: 0 = definitely will not recommend, 10 = definitely will recommend.
Maintain consistent labels across your entire CX program. Avoid unbalanced scales (with a predominance of positive descriptions), as they inflate results and make them harder to interpret.
Different scales (5, 7, 10, 11) generate different distributions of responses across categories, which affects: the mean and median, the proportion of positive ratings (top-box, top-2-box), the proportion of negative ratings (bottom-box), the percentage of promoters and detractors (in NPS), and sensitivity to minor changes in the experience.
When you calculate the average of responses on a 5-point scale and compare it to the average of a 10-point scale, you may draw misleading conclusions. Changing the scale during a CX program (e.g., from 5 to 7 points) requires parallel measurement or analytical adjustments. Business reports should not rely solely on the average—it is worth showing the distribution of ratings, top-box scores, and segmentation.
More detailed scales (7, 10) provide more data for statistical analysis (e.g., correlations), but require greater methodological discipline and clear rules for interpretation.
Directly comparing results from different scales (e.g., an average of 4.2/5 and 8.3/10) is risky. 4/5 (80%) is not the same as 8/10 (80%), because respondents use the 5-point and 10-point scales differently, and their responses generate a different distribution and “weight” of extreme ratings.
You can use percentage conversions, but always with caution and a clear description of the assumptions. Recommendation: maintain a single scale for the same metric and process (e.g., post-purchase CSAT always 1–5). If you need to change the scale, mark the change point in reports and conduct parallel measurements across several survey waves.
5- or 7-point scales are most commonly recommended for the majority of CX metrics. Specific recommendations are provided below.
The table below summarizes the key differences between the scales used in CX surveys.
Scale type | Best use | Main advantages | Main limitations | Sample question | YourCX recommendation |
|---|---|---|---|---|---|
5-point | Transactional CSAT, mobile surveys, pop-ups | Simplicity, speed, high response rate | Less detail, ceiling effect | “How would you rate the quality of service?” (1–5) | Use for short transactional and mobile surveys |
7-point | CES, UX research, B2B relationships | Better precision, good factor structure | Requires good labels, longer response time | “How easy was it to resolve the issue?” (1–7) | Choose this when you need greater resolution |
10-point | Overall experience rating, internal surveys | High detail, familiar format | No natural midpoint, risk of overinterpreting the average | “How would you rate the purchase process?” (1–10) | Use with caution, with clear interpretation thresholds |
11-point scale (0–10) | NPS – loyalty, recommendation | Market standard, comparability, segmentation | Does not measure satisfaction with the interaction, requires a large sample size | “How likely are you to recommend the company?” (0–10) | Exclusively for NPS with classic segmentation |
Likert scale | Surveys on attitudes, UX, opinions, agreement with statements | Flexibility, ability to build indices | Not for every question; requires statements | “The purchasing process was simple” (1–5 or 1–7) | For attitude surveys, UX, and process evaluations |
The table is for reference only—in practice, consistency within a given CX program is more important than an “ideal” scale.
The table below shows recommended scales for specific business cases.
Research objective | Recommended scale | Question type | Practical note |
|---|---|---|---|
Relational NPS (brand loyalty) | 0–10 | NPS | Market standard; only with a recommendation question |
Post-purchase CSAT in e-commerce | 1–5 | CSAT | Simplicity, quick feedback, easy top-2-box |
CES after customer service interaction | 1–7 | CES / Likert | A 7-point scale better reflects the effort |
Survey after the online process (application, registration) | 1–5 or 1–7 | CSAT / Likert | 5 points for a simple process, 7 points for a critical one |
UX testing of a website or app | 1–7 (Likert) | Likert scale | Set of statements, ease-of-use index |
B2B relationship survey | 1–7 | CSAT / Likert | Greater sensitivity to changes between waves |
In-store service rating | 1–5 | CSAT | Quick survey on a tablet, minimal burden |
It’s worth establishing an internal rating scale standard for the most important CX metrics—and applying it consistently.
Below is a list of common issues we observe in Voice of Customer programs:
Standardizing scales in a large organization is a logistical challenge. A CX platform, such as YourCX, can help in several ways:
Standardizing scales on the platform reduces the time from data collection to operational action and facilitates comparing results across teams.
Before launching the survey, go through the following questions:
Below are answers to questions that frequently arise when designing research programs.
First, select the target rating scale standard (e.g., 0–10 for NPS, 1–5 for CSAT) and gradually migrate all surveys to this standard. Implement a transition period with parallel measurement on both the old and new scales at key points in the customer journey. Clearly mark the point of scale change in reports to avoid overinterpreting spikes in results.
Simplify the scale (e.g., switch from 10 to 5–7 points) and clarify the labels for the extreme values and the midpoint. Test the survey on a small sample before rolling it out on a large scale. An unclear scale reduces data quality more than a smaller number of points.
For the same metric (e.g., post-contact CSAT), it’s best to use the same scale across all channels to make it easier to compare results. Minor differences in presentation format (e.g., stars on mobile, numbers in email) are acceptable, provided the number of levels and labels remain consistent. Centralized management of survey templates, e.g., in a CX platform, reduces the risk of inconsistencies.
The scale should remain as consistent as possible. Changes should only be made when there is a clear reason to do so (e.g., integration of research programs, internationalization). With every change, you must: clearly indicate this in reports, plan a comparison period (parallel measurement), and update KPI definitions for operational teams.
Graphical scales can improve the survey’s UX (especially on mobile), but behind the scenes, they should be mapped to a consistent numerical scale (e.g., 1–5). More important than the visual form is the consistency of numerical values and their interpretation across channels. In documentation and internal reports, always use an explicit numerical scale, regardless of whether the client sees stars or numbers.
The best rating scale for a survey depends on the survey’s objective, not on a universal rule. A 5-point scale offers simplicity and a high response rate. A 7-point scale provides greater precision and works well in analytical research. A 10-point scale requires careful interpretation and clear thresholds. The 0–10 scale (11 points) is the NPS standard—use it exclusively with the classic recommendation question.
Final tips:
Start with the question: what business decision is the survey meant to support? Only then should you select the appropriate scale that will “feed” that decision with reliable data.
Copyright © 2023. YourCX. All rights reserved — Design by Proformat
