- Research platform
Sources of information
Data analysis
Actions

- Solutions
For whom
Problems / Issues

- Materials
Materials
- About us
About us
Net Promoter Score is a consumer loyalty assessment methodology designed to increase revenue based on the optimization of the customer experience. 9 out of 10 consumers say that the recommendations of friends and family are the most important when making a purchasing decision. Word of mouth marketing is, therefore, the most effective form of marketing!
Everyone who has contact with Customer Experience research heard about the Net Promoter Score system. Companies around the world are using this methodology, from small businesses to large corporations. Consumers are confronted with the famous question “how likely is it that you would recommend…” every day: Microsoft regularly asks this question to all Windows users, Electronic Arts to their players, Delta Air Lines to passengers, Apple to customers, and LEGO to brick building enthusiasts. NPS has grown quite quickly in the core of CX research, being today the most frequently used loyalty indicator in the world.
Due to the widespread use of Net Promoter Score, many myths and misunderstandings have arisen around it. In everyday work, we often also encounter an incomplete understanding of what NPS is and what opportunities it offers. Undoubtedly, the greatest benefits can be obtained only through proper interpretation of results and well thought-out data segmentation, therefore we will present here some practical examples of such analyzes.
How to calculate the NPS score?
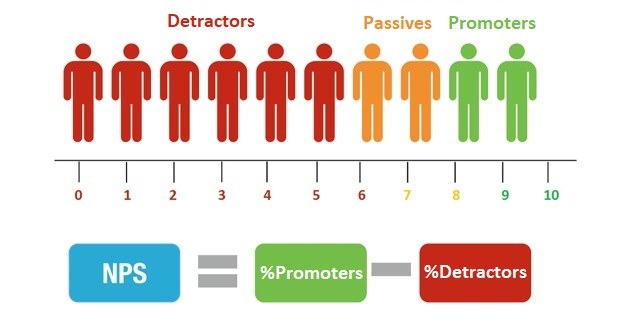
The NPS indicator is based on one question: How likely is it that you will recommend this brand/product/service to your friends and/or family?
The recipient determines the probability on a scale from 0 (would not recommend) to 10 (would certainly recommend). On the basis of these assessments, the respondents are divided into three groups: Detractors (those who definitely will not recommend that particular brand/product/service, they choose values from 0 to 6), Passives (satisfied, but not willing to recommend, choosing 7’s and 8’s) and Promotors (loyal fans of the brand, choosing values 9 and 10). The goal is to understand the reasons why Detractors are dissatisfied and what makes Promoters so happy and loyal.
The NPS indicator itself is the result of a simple mathematical operation: we subtract % of Detractors from % of Promotors. For example, if we are willingly recommended by 50% of our clients, 20% are Passives and 30% are Detractors, then after deducting 30 from 50 we get the result: 20. This is your NPS indicator. Passives are omitted.
Use of the NPS
The NPS result alone does not give you much if it is not analyzed in the right context. One of the basic applications is monitoring the condition of the brand/product/service in relation to changes over time, and referring fluctuations and trends to what is changing and how you optimize the business. In special cases, eg gradual transfer of part of the traffic to a new version of the website, A/B test research will tell you which features have a better effect on experiences. You will also get useful feedback, which will help you in fixing problems reported by users. YourCX also offers sector-specific benchmarks, thanks to which you will be able to refer changes in the NPS result to market trends and competition activities.
You will gain more insights by segmenting data according to specific parts of the website, stages of the purchasing process or other questions and data. For example, in the case of Customer Service surveys (regardless of the channel, whether through live chat, telephone, SMS or traditional points of contact), you can use segmentation with additional contextual data, eg. consultant’s id or conversation subject. Many companies use the Net Promoter Score in the bonus system, rewarding those employees who can boast of a high probability of recommendation. The collected feedback also allows you to optimize service-related processes, eg. through training of less-rated consultants. The collected feedback also allows determining what kind of knowledge or competences are missing from the consultants.
Larger research projects are based on crossing large amounts of data and segmentation of behaviors into groups of Promotors, Passive and Detractors. YourCX performs such analyzes, for example, in relation to influence of offline experiences in Multikino cinemas on online purchases or specific types of problems in telecommunications service providers such as Play, Plus and T-Mobile. The NPS indicator can also be used in remarketing , for example, by directing advertising to Promoters who are more likely to respond positively.
Examples of NPS analyzes
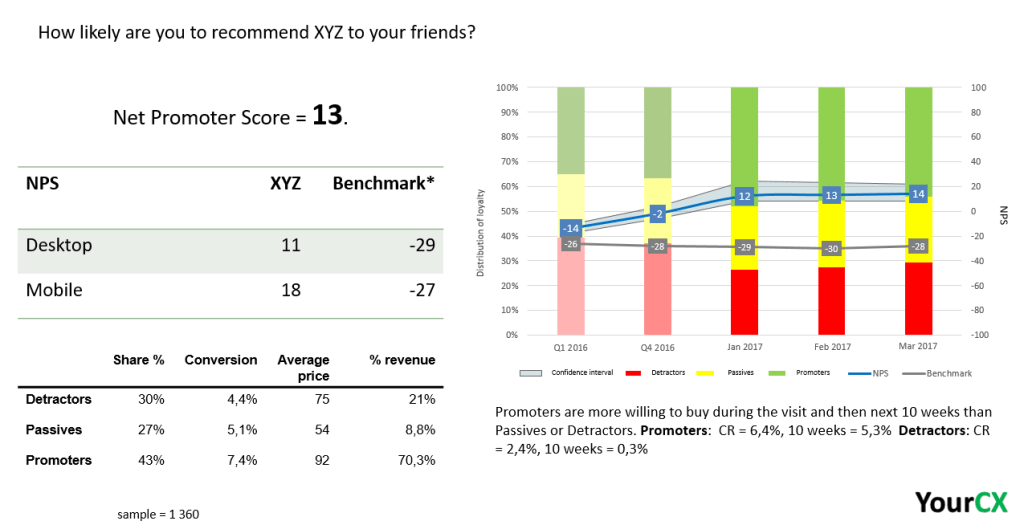
The following example combines data from various sources: the NPS indicator, the average order value for individual groups, the conversion rate as part of the visit, the conversion rate for the subsequent 10 weeks divided into Detractors and Promoters, a distinction between desktop and mobile, and reference to the market benchmark. This data relates to consumer behavior within one quarter, but with reference not only to the results of individual months, but also the results in the previous quarter and the corresponding quarter.
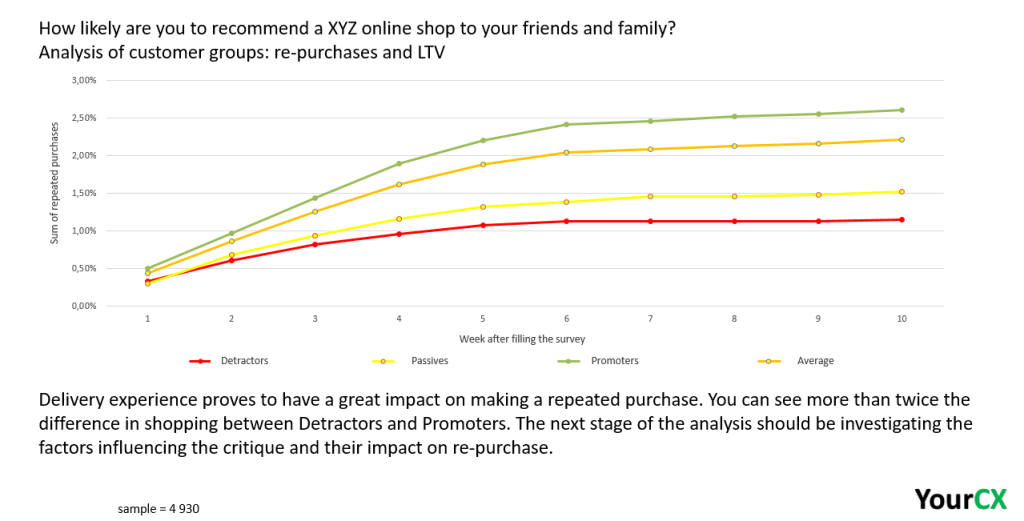
Below is another example. Here we are exploring a total percentage of re-purchases with the division into Detractors, Passives, and Promoters. The research concerns the direct delivery of products, hence the analysis is aimed at examining the impact of shopping experience (with an emphasis on logistics) in relation to how particular groups behave in the next 10 weeks. As you can see, the impact is significant: we have more than double the difference in purchases between the Detractors and Promoters. The next stage of such analysis should be to examine specific factors influencing dissatisfaction.
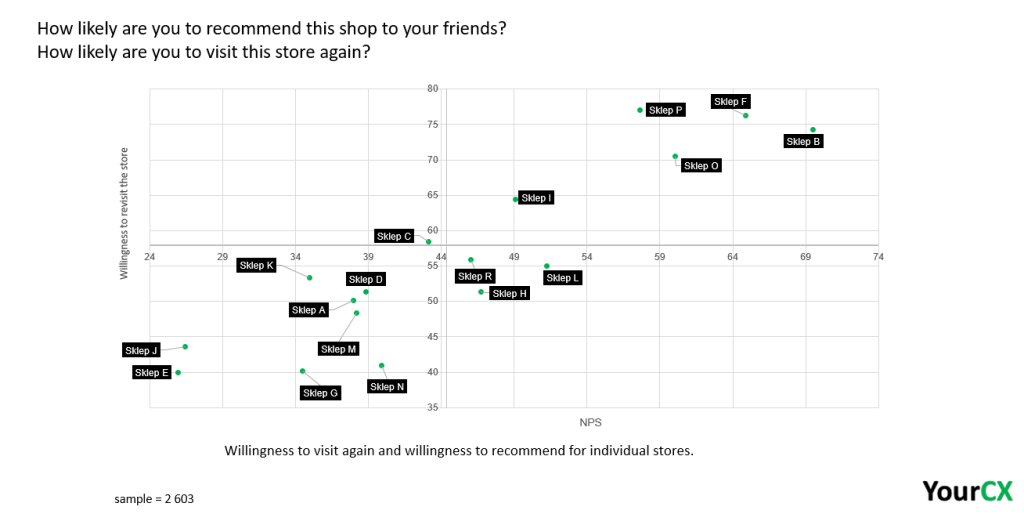
Below is an example of connection of the NPS indicator (the probability of recommending a brand to a friend) with the desire to re-purchase (where we use a similar methodology as in the case of Net Promoter Score, but asking about the probability of return). Segmentation, on the other hand, applies to individual traditional stores. On the basis of this type of analysis, it is easy to determine which locations can boast the highest quality of service and in which problems arise. Further analyzes helps in identifying specific problems.
Does Net Promoter Score have flaws?
In recent years, there have been as many articles praising the NPS as those pointing out its flaws. It is difficult to analyze every “flaw”, refute “myths” or defend “advantages”. No doubt, it all depends. Among other things from:
NPS is therefore like a human being, it can’t be “bad” or “good”. It depends on how we collect the data, what we do with the collected data, what conclusions we will draw and how we will then translate them into the actual improvement of the consumer experience. Because this is the main point here: to improve satisfaction and, as a result, increase the word of mouth marketing, loyalty and, finally, revenues. If it did not work, nobody would deal with it, and I would not write this text today.
Copyright © 2023. YourCX. All rights reserved — Design by Proformat

