

- Research platform
Sources of information
Data analysis
Actions

- Solutions
For whom
Problems / Issues

- Materials
Materials
- About us
About us
Data collected through YourCX system is presented in a transparent admin panel that can be used by both researchers and analysts, as well as by project managers, directors and others involved in a wide range of consumer experience optimization activities. Our analytical tools work both with declarative data collected through surveys and any technical and segmentation data that complements the gained knowledge with a relevant context.
The solutions we use to facilitate data analysis include the following features:
General overview of results
The executive view gives an overview of current situation for all surveys within the selected time range (default by quarters) compared with the previous period and the corresponding period of the preceding year. Graphical indications allow for quick viewing of the situation (drops and increases are clearly visible) and time ranges can be freely modified. The form of preview has been designed based on many years of experience in cooperation with Clients who use such reports to analyse current changes and trends, most often as comparisons between months and quarters.
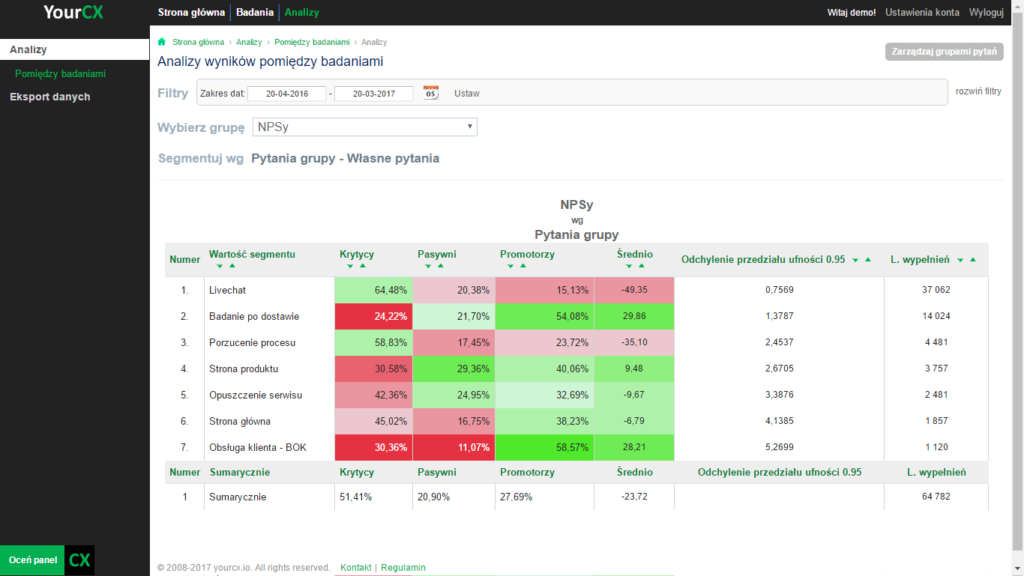
Inter-survey analysis
Analysis of indicators used in many surveys is facilitated by a specially designed system to compare them between the surveys. For the most commonly used indicator of that type – the NPS – the system shows the share of Detractors, Passives and Promoters, together with correct NPS calculation, deviation for a confidence interval and number of fillings broken down by all surveys, with the option to segment the results according to any variables. The platform presents also the averaged results showing general condition of the brand. Such view allows e.g. for a quick comparative analysis of trends in surveys related to online and transactional websites, as well as to offline establishments.
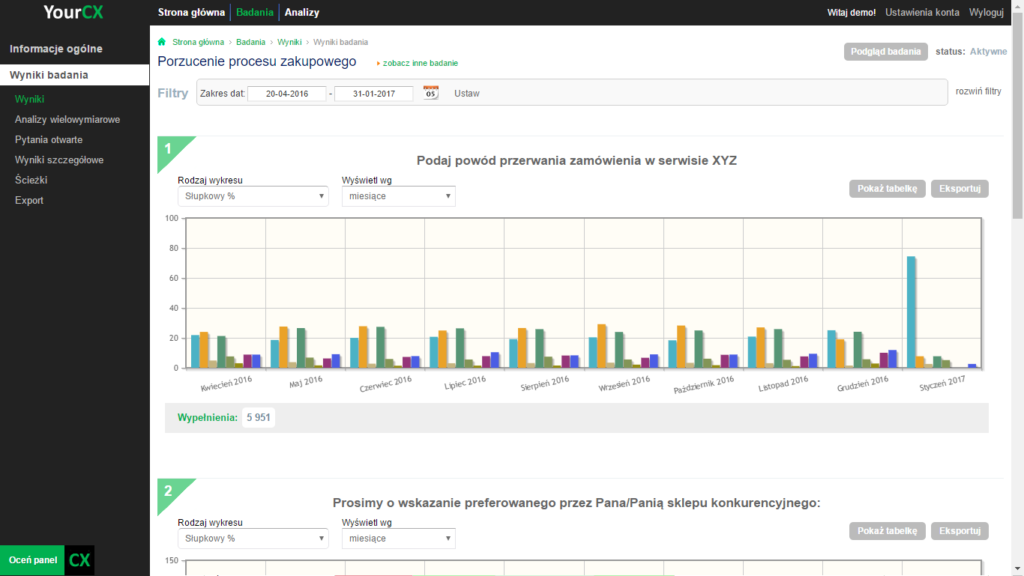
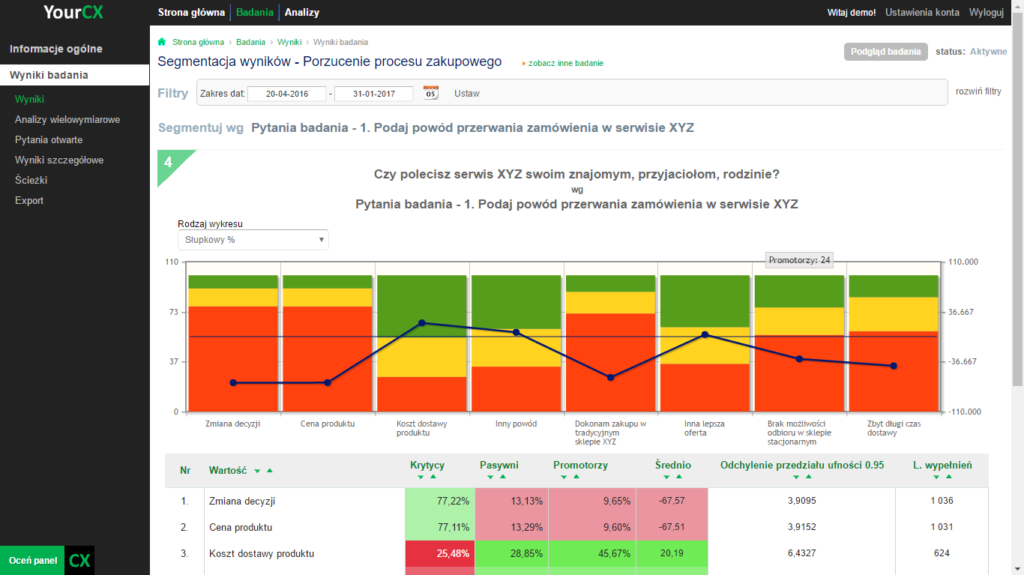
Analysis of individual questions
The view of the results for individual questions contain all the necessary information – graphical (graph) and in a table. Using that view, it is also possible to segment the results relative to other questions of the same survey, Client’s segments (provided on completion of the survey questionnaires, such as website type, customer characteristics, etc.), technical data (e.g. broken down by mobile and desktop, domain-specific segmentation, browser or OS type), analytical data (e.g. visit number, duration of visit, break-down into new and returning users, number of page display during a visit), time (day, week, month, quarter, time of the day, day of week, day of month) or based on the method of loading the survey (e.g. with regard to the product analysed or by pictogram mode). YourCX makes the most out of available technical solutions to complement declarative data with such parameters. They allow learning fuller context of the responses, verifying the hypotheses, and advanced analytics. Segmentation is a fundamental tool for analysing trends and behaviours of particular customer groups as well as for detecting anomalies between individual sections of a website.
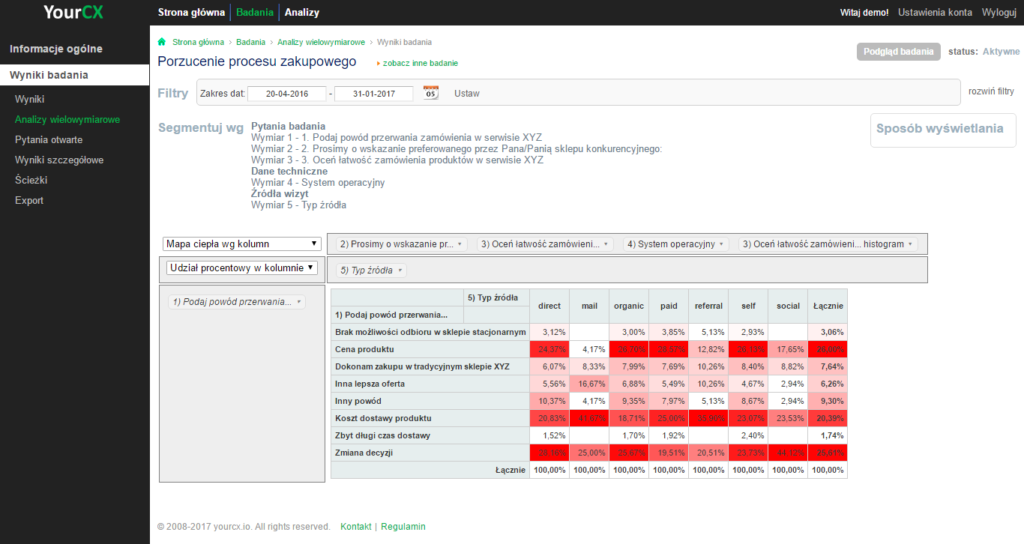
Multivariate analysis and pivot tables
All of the parameters indicated above can be used to segment data in multivariate analyses, including in pivot tables. They may be used for combining questions, segmentation based on technical data or Client’s parameters, grouping by NPS, etc. Multivariate analyses include several different views and each of them can be freely modified. Pivot tables allow also to freely display and convert results, create charts, heatmaps, and ready-to-use charts for analytics. In addition to pivot tables, collective multivariate analysis, parallel coordinates and parallel sets are available.
Data export features
All data can be exported to XLSX and CSV files. That option is available from a variety of data analysis levels – from general analysis, through individual analysis to analysis of open answers. The exported data can be processed without further restriction or imported into other analytical systems used by the Clients.
Analysis of open answers
The open answers analysis tool enables viewing all open answers across all the surveys. General information, such as the date of completion and the content of the answer, is provided in the overview, together with an intuitive way to navigate to the details relating to completion of the questionnaire (for a complete context of the answer).
Detailed results
Detailed results enable reaching more detailed data for individual completed items of questionnaires. Individual results pages contain complete information about declarative and technical data, including a preview of the attached screenshots (if such feature was used in the survey).
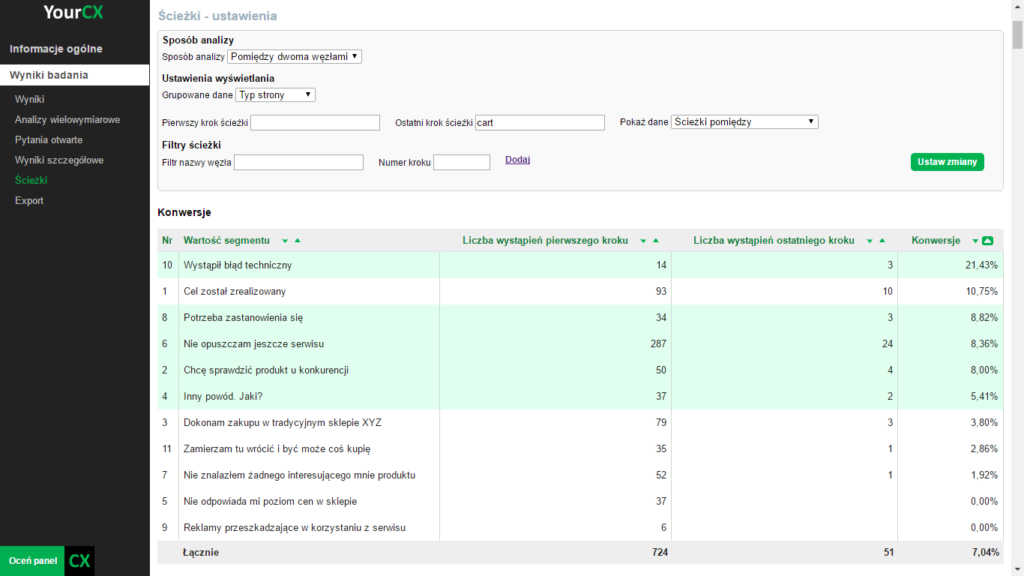
Path analysis
Users’ visits to the website can be tracked, allowing you to specify their exact steps, i.e. to save the history of pages and subpages they visited, taking into account the time spent on particular points. YourCX’s path analysis tool allows for advanced segmentation of history of visits by specific types of users, such as already mentioned group of Detractors, Promoters or Passives, by purpose of the visit, reason for leaving the website, specific technical problem, or based on Client’s segments, e.g. type of user account.
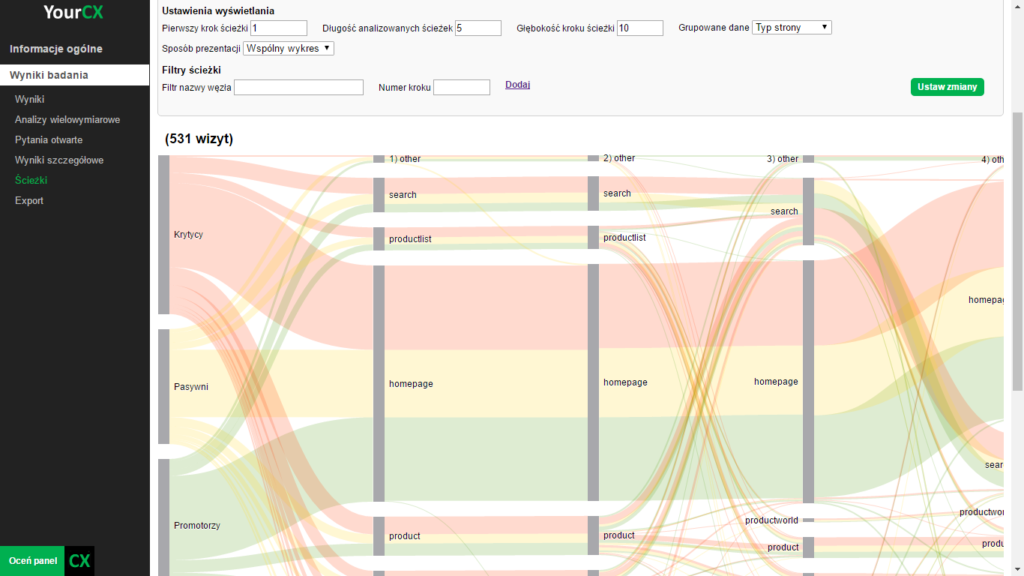
Features of path analysis tool:
Applications of path analysis tool:
Weighted results
All the data can be further processed using the tool for weighting the results. The results may be weighted e.g. by the demographic structure of Internet users or in any other way. Data is calculated automatically and may be further analysed in that form. The feature is useful when the results obtained can be distorted due to the selected variables and it is necessary to convert them, for example, according to the structure of Internet users in Poland.
Those are only some of analytical capabilities included in the applications we provide to you. Visit our website, take advantage of free trial version and see for yourself how versatile and useful our tool is!
Copyright © 2023. YourCX. All rights reserved — Design by Proformat
