

- Research platform
Sources of information
Data analysis
Actions

- Solutions
For whom
Problems / Issues

- Materials
Materials
- About us
About us
The gap between promised and delivered customer experiences continues to widening, making it crucial for businesses to track the right customer experience metrics. Most organizations struggle to translate customer feedback into actionable improvements.
This comprehensive guide explores the top 10 customer experience metrics for 2025, providing practical definitions, calculation methods, industry benchmarks, and real-world applications that connect directly to business outcomes like customer retention, revenue growth, and competitive advantage.
Customer experience metrics are key performance indicators that quantify how customers perceive, feel about, and interact with your brand across every touchpoint of the customer journey. Unlike general business metrics that focus on operational performance, these experience metrics capture the qualitative aspects of customer relationships—measuring satisfaction, effort, loyalty intent, and emotional responses that precede behavioral changes.

In 2025’s challenging landscape, where most brands failed to improve their customer experience, the ability to measure customer experience accurately has become a critical competitive differentiator. Companies that excel at customer experience measurement report:
Relying on a single metric can be misleading and provide an incomplete picture of your customer experience. For example, a high net promoter score might coexist with pockets of high customer effort in support interactions, potentially hurting long-term customer retention.
The most effective approach combines:
This multidimensional approach provides a balanced scorecard that helps businesses understand both the “what” and “why” behind customer behavior.
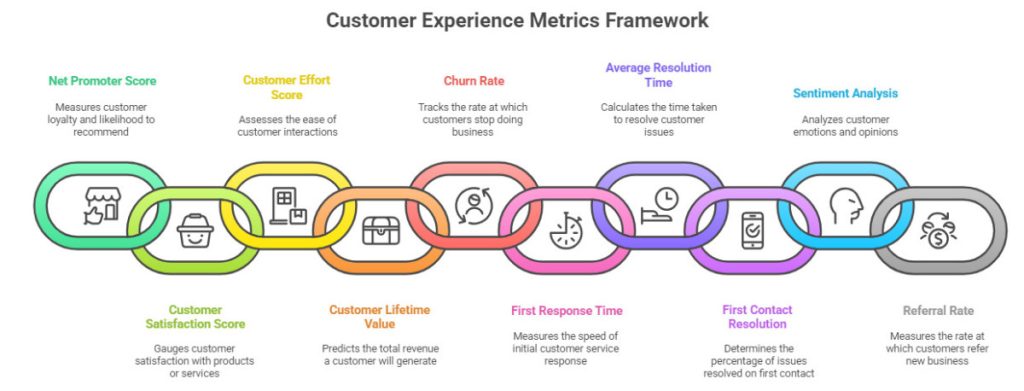
Net promoter score nps measures customer loyalty and advocacy by asking one simple question: “How likely are you to recommend [brand] to a friend or colleague?” on a 0-10 scale. The calculation involves subtracting the percentage of detractors (0-6) from the percentage of promoters (9-10), with passives (7-8) excluded from the formula.
Why NPS Matters in 2025
As customer acquisition costs continue rising and retention becomes increasingly critical, net promoter score serves as a leading indicator of organic growth potential. In a year when many brands struggled with customer experience delivery, maintaining or improving NPS becomes essential for preserving market share and stimulating word-of-mouth referrals.
Implementation
Deploy both relationship NPS (quarterly brand sentiment) and transactional NPS (post-interaction feedback) with automated follow-up workflows. For instance, after a customer completes a return process, trigger a transactional NPS survey. Route detractors to customer service teams for immediate outreach while using AI sentiment analysis on open-text responses to identify root causes of dissatisfaction.
Customer satisfaction score csat measures satisfaction with specific interactions, products, or services using simple rating scales (typically 1-5 or 1-10). The metric is calculated as the percentage of positive responses, usually focusing on top-box scores (4-5 on a 5-point scale).
Practical Applications
CSAT excels at identifying friction in specific customer journey stages. In e-commerce, trigger customer satisfaction surveys after checkout completion and delivery to analyze performance by payment method, device type, and shipping carrier. This granular data helps correlate low satisfaction cohorts with higher return rates or increased support contacts, quantifying the business impact of customer frustration.
Operational Integration
Use CSAT trends to guide targeted improvements such as simplifying address forms, adding real-time inventory transparency, or improving delivery estimate accuracy. Monitor satisfaction lifts following these changes to validate ROI and inform future optimization priorities.
Customer effort score ces measures how easy customers find it to complete specific tasks, typically using agreement scales for statements like “The company made it easy for me to resolve my issue.” Lower effort correlates strongly with higher customer satisfaction and reduced customer churn risk.
Strategic Value in 2025
With many brands failing to improve overall customer experience, focusing on effort reduction provides a pragmatic lever that reliably improves satisfaction while reducing cost-to-serve. CES is particularly valuable for optimizing support flows and self-service options.
Support Optimization Use Case
Deploy post-chat CES surveys to identify customer inquiries requiring multiple transfers or lengthy verification processes. Combine with first contact resolution and average resolution time metrics to assess whether AI-assisted knowledge surfacing reduces customer effort. Use journey mapping to attribute CES improvements to specific process changes like authentication redesign or streamlined escalation paths.
Customer lifetime value clv predicts the total revenue a customer will generate over their entire relationship with your brand. CLV models incorporate average order value, purchase frequency, average customer lifespan, and retention probability to forecast long-term economic impact.
Business Alignment
CLV transforms customer experience investments from cost centers into revenue drivers by demonstrating clear connections between experience improvements and financial outcomes. High-value customers justify premium service investments, while CLV segmentation helps prioritize retention campaigns efficiently.
Predictive Analytics Application
Combine behavioral signals (visit frequency, product mix), support history (first contact resolution, customer effort score), and sentiment analysis from customer feedback to predict at-risk high value customers. Trigger proactive outreach campaigns and track CLV changes following intervention to measure program effectiveness.
Feedback response rate measures the percentage of invited customers who respond to feedback requests. This program health metric directly influences data accuracy and representativeness—low response rates can skew insights and reduce confidence in business decisions derived from customer data.
Impact on Data Quality
Higher response rates increase both volume and diversity of customer feedback, improving statistical confidence and enabling more granular segmentation by journey step, device type, and communication channel. This enhanced data quality improves root-cause analysis and helps prioritize improvements based on broader customer perspectives.
Optimization Strategies
Boost response rates through personalization, concise survey design, optimal timing aligned with key customer moments, and multichannel prompts spanning web intercepts, in-app notifications, email, and SMS. Voice surveys and conversational feedback options can reduce friction and significantly increase participation rates.
Journey completion rate tracks the percentage of users who successfully complete defined customer journey steps or end-to-end flows, such as purchase completion, booking confirmation, or form submission. This metric bridges customer experience and product analytics by highlighting friction points that correlate with low satisfaction and increased support contacts.
2025 Relevance
As products and services converge across industries, seamless customer journeys become key differentiators. Journey analytics capabilities are increasingly recognized as priority features in enterprise CX platforms, helping organizations identify and eliminate abandonment triggers.
Journey Analysis
Combine event stream data (page views, clicks, errors) with embedded customer satisfaction score and customer effort score prompts at critical micro-steps. This integration identifies where customer dissatisfaction coincides with drop-off patterns, enabling targeted fixes like reducing form fields or improving error messaging that drive measurable improvements in both completion rates and downstream revenue metrics.
First contact resolution measures the percentage of customer issues resolved in a single interaction without requiring follow-up contacts. Higher FCR rates reduce customer effort, improve customer satisfaction scores, and lower cost-to-serve while enhancing overall service quality.
Operational Benefits
FCR serves as a powerful lever for improving both customer experience and operational efficiency simultaneously. By resolving customer issues during the initial contact, organizations reduce repeat inquiries, decrease customer frustration, and optimize support team productivity.
Enhancement Strategies
Improve first contact resolution through robust, searchable knowledge bases, AI-assisted agent guidance systems, better call routing with comprehensive context sharing, and proactive status updates that prevent repeat contacts. Monitor FCR alongside customer effort score to ensure faster resolution doesn’t compromise perceived ease of interaction.

Sentiment analysis score uses AI-driven analysis to evaluate customer emotions and sentiment polarity across open-text survey responses, reviews, chat transcripts, emails, and social media mentions. Scores aggregate at brand, journey, or topic levels and track perception shifts over time.
Real-Time Intelligence
As overall customer experience quality faces persistent challenges, real-time sentiment monitoring helps leaders detect and respond to emerging issues before numeric scores decline materially. Sentiment analysis enriches driver analysis for net promoter score and customer satisfaction score while quantifying the impact of specific themes like shipping delays or app crashes on customer loyalty.
Multilingual Capabilities
Sentiment analysis processes customer feedback across multiple languages, clustering topics and surfacing trend dashboards that integrate with CRM and support tools. This enables automatic flagging of negative sentiment among high customer lifetime value accounts for immediate escalation and intervention.
Customer churn rate measures the percentage of customers lost over a specific period, calculated as (customers lost ÷ starting customers) × 100. This critical outcome metric connects customer experience quality directly with retention economics and should be segmented by acquisition cohort, product line, and experience metric segments.
Predictive Modeling
Combine behavioral indicators (declining usage, increased support contacts), customer feedback (detractor NPS scores, low customer satisfaction), and sentiment analysis to predict churn risk and trigger proactive interventions. These might include special offers, concierge support, or educational content designed to address specific customer needs and pain points.
Business Impact
With macro economic pressures and stagnant customer experience at many organizations, churn control becomes essential for sustainable business growth. Effective churn prediction and prevention programs can significantly impact customer retention and reduce the cost of acquiring new customers to replace those lost.
Customer referral rate measures the percentage of existing customers who successfully refer new customers, typically tracked through referral codes or CRM attribution systems. This metric correlates strongly with advocacy intentions measured by net promoter score while capturing actual behavioral outcomes rather than stated intentions.
Growth Engine Potential
As paid customer acquisition costs remain elevated, referral-driven growth provides a cost-efficient channel for customer base expansion. While net promoter score serves as a proxy for advocacy potential, referral rate captures realized word-of-mouth behavior, providing a complete view of organic growth effectiveness.
Program Implementation
Design referral programs with optimal timing (triggered after positive customer interactions), minimal friction, and appropriate incentives. Automatically invite customers who demonstrate promoter behavior through transactional NPS or positive sentiment analysis, measuring program effectiveness through control group comparisons.
First response time measures how quickly organizations initially respond to customer inquiries, while average resolution time art tracks the total time required to fully resolve customer issues. Though not always featured in generic top 10 lists, these service metrics directly influence customer effort score, customer satisfaction score, and first contact resolution rates.
Service Excellence Impact
Faster initial responses reduce perceived neglect and prevent customer defection to competitors. Shorter resolution times correlate with higher customer satisfaction and lower churn rates, particularly in support-intensive industries. Monitor these metrics by communication channel and issue type, pairing with customer effort score to ensure speed improvements maintain quality and ease of interaction.
AI-Enhanced Efficiency
Implement AI triage systems to automatically route and summarize customer issues for faster agent handling. Track the impact of these technological improvements on both response metrics and downstream customer satisfaction, demonstrating the ROI of automation investments.
Checkout and Delivery Optimization
Deploy customer satisfaction score surveys at checkout completion and post-delivery, monitoring journey completion rate throughout the purchase flow. Segment performance data by device type, payment method, and logistics partner to identify systematic friction points. Negative sentiment themes around “late delivery” or “packaging damage” often precede product returns, enabling proactive targeting of carrier and packaging improvements with measurable customer satisfaction lifts.
Returns Experience Enhancement
Use transactional net promoter score and customer effort score surveys following return completions to identify loyalty risks among previously satisfied customers. Streamlining return label processes and status communications typically improves customer effort scores and increases repeat purchase rates among affected customer segments.
Onboarding and Adoption
Track journey completion rate for key onboarding tasks while measuring customer effort score for setup flows. Combine with customer lifetime value and churn prediction models to identify accounts requiring proactive success interventions. Pair first contact resolution and average resolution time metrics to quantify support’s contribution to user adoption and long-term customer retention.
Advocacy Development
Use net promoter score tracking to identify promoter segments, then trigger referral program invitations through automated workflows. Monitor customer referral rate alongside lifetime value of referred users to quantify the economic impact of word-of-mouth growth strategies.
Omnichannel Service Excellence
Implement transactional customer satisfaction score surveys after buy-online-pickup-in-store (BOPIS) and buy-online-return-in-store (BORIS) interactions. Measure customer effort score for in-store return counter experiences while tracking first contact resolution for customer service interactions. Sentiment analysis across local review platforms can identify store-level experience issues such as wait times or staff availability challenges.
High-Value Customer Protection
Use customer lifetime value segmentation to prioritize outreach efforts for valuable customers impacted by negative experiences. This targeted approach ensures resource allocation focuses on protecting relationships with the most valuable customers while maintaining overall service quality standards.

Successful customer experience measurement follows a systematic four-step approach:
Choose a comprehensive CX analytics platform that provides:
Timing Optimization: Trigger surveys immediately following key customer interactions to maximize recall accuracy while avoiding delays that degrade response quality. Keep surveys concise and focused to prevent customer fatigue and maintain high response rates.
Multichannel Approach: Deploy feedback collection across web and mobile app intercepts, email and SMS campaigns, and voice input options to accommodate diverse customer preferences and increase overall participation.
Closing the Loop: Acknowledge customer feedback promptly, resolve identified issues quickly, and communicate improvements back to customers. This process builds trust, improves future response rates, and demonstrates genuine commitment to customer experience enhancement.
Trend Analysis: Combine quantitative score trends with qualitative sentiment themes to identify the primary drivers of detractor states and low satisfaction at specific journey steps. This holistic approach enables more accurate prioritization of improvement initiatives.
Prioritization Framework: Evaluate opportunities based on affected customer volume, sentiment severity, and economic impact measured through customer lifetime value and churn risk. Run controlled pilots for proposed changes and measure impact on target metrics plus revenue proxies like conversion rates and repeat purchase behavior.
ROI Calculation: Calculate customer retention improvements, churn reduction percentages, and incremental customer lifetime value gains from customer cohorts exposed to experience improvements versus control groups. Report return on investment in financial terms to sustain executive support and continued program investment.
Survey Fatigue: Over-surveying customers and deploying lengthy questionnaires reduces response rates and compromises data quality. Focus on essential questions and rotate survey modules to maintain engagement while gathering comprehensive insights.
Vanity Metrics: Celebrating high scores without addressing underlying negative themes in open-text feedback or ignoring non-respondent behavior patterns can create false confidence. Always triangulate survey data with behavioral analytics and sentiment analysis for complete understanding.
Measurement Without Action: Customer experience metrics must feed closed-loop processes and inform change roadmaps, or they risk eroding customer trust and wasting organizational resources. Ensure every metric connects to specific improvement initiatives and accountability structures.
Qualitative Data Neglect: Open-text responses and social media sentiment provide critical context for diagnosing issues and tracking perception changes that quantitative scores alone cannot capture.
Mainstream adoption of predictive models that forecast customer churn and customer lifetime value using combined behavioral and feedback data enables proactive customer retention and value expansion strategies. These models help organizations intervene before customer relationships deteriorate rather than reacting to problems after they impact satisfaction scores.
The growth of voice feedback and conversational analytics provides lower-friction, higher-response channels that capture emotion-rich customer input. Voice surveys require AI transcription and sentiment analysis to scale effectively but offer significant advantages in response rates and insight depth compared to traditional text-based surveys.
Continuous scanning across first-party and third-party channels detects spikes in negative sentiment themes, enabling rapid response to emerging issues before they impact broader customer satisfaction metrics. This proactive approach helps organizations maintain competitive advantage through superior responsiveness to customer concerns.
What is the most important customer experience metric to track in 2025?
There is no single most important metric—successful customer experience measurement requires a portfolio approach combining relationship metrics (net promoter score, customer lifetime value), transactional metrics (customer satisfaction score, customer effort score), service metrics (first contact resolution, first response time, average resolution time), and outcome metrics (customer churn, referral rate). This multidimensional coverage provides comprehensive insights across the entire customer journey.
How often should companies measure customer experience metrics?
Measurement frequency depends on the metric type: deploy transactional surveys immediately post-interaction, conduct relationship surveys (net promoter score) quarterly or semi-annually, monitor operational metrics continuously through system logs, and track outcome metrics monthly or quarterly. The key is maintaining consistent measurement cadence while avoiding survey fatigue.
What’s the difference between customer experience metrics and customer satisfaction metrics?
Customer experience metrics encompass perceptions and behaviors across the entire end-to-end customer journey, including loyalty intentions, effort levels, and sentiment analysis. Customer satisfaction metrics focus specifically on satisfaction with particular interactions or touchpoints. Customer satisfaction represents one component of the broader customer experience measurement framework.
How can small businesses implement CX measurement with limited resources?
Start with lightweight net promoter score and customer satisfaction score surveys at critical touchpoints like post-purchase and post-support. Use a platform with built-in dashboards and CRM integration to minimize manual work. Focus on closing the feedback loop and implementing a few high-ROI improvements rather than attempting comprehensive measurement from the beginning.
What are typical benchmarks for NPS, CSAT, and CES scores across industries?
Benchmarks vary significantly by industry, region, and company size. Rather than relying on generic cross-industry averages, use platform-specific benchmarking features that provide relevant peer comparisons. Focus on tracking trends and improvement rates within your organization while using industry benchmarks as general reference points for goal setting.
How do you calculate ROI from customer experience improvements?
Connect metric improvements to concrete business outcomes: reduced customer churn, increased upsell and cross-sell success, and referral-driven customer acquisition. Model incremental customer lifetime value and margin impact from experience initiatives, validating results through cohort comparisons and controlled testing. Express ROI in financial terms that resonate with executive stakeholders.
What tools are essential for measuring customer experience metrics effectively?
Essential technology includes a comprehensive CX analytics platform with omnichannel survey capabilities, AI-powered sentiment analysis, journey analytics, real-time dashboards, and system integrations. Supporting tools should include CRM systems for customer data management, customer support platforms for service metrics, and product analytics for journey completion tracking.
How can companies act on poor CX scores to improve customer relationships?
Implement rapid triage and resolution processes for customers providing negative feedback, conduct thematic root-cause analysis to identify systemic issues, prioritize fixes based on impact and feasibility, and communicate changes back to affected customers to rebuild trust. The key is creating closed-loop processes that demonstrate responsiveness and commitment to continuous improvement.
The top 10 customer experience metrics for 2025 provide a comprehensive framework for understanding and improving how customers perceive and interact with your brand. In a year when most organizations struggled to maintain customer experience quality, those that measure effectively and act on insights will gain significant competitive advantage.
Success requires combining transactional feedback with relationship metrics, operational efficiency measures with behavioral outcomes, and quantitative scores with qualitative sentiment analysis. The goal isn’t perfect scores—it’s actionable insights that drive meaningful improvements in customer relationships and business results.
YourCX’s comprehensive platform combines omnichannel feedback collection, AI-powered sentiment analysis, predictive analytics, and journey mapping to help organizations implement this complete measurement framework. Our integrated approach connects customer experience metrics directly to retention, revenue, and growth outcomes. Start measuring what truly matters today and turn every customer interaction into a driver of long-term success.
Copyright © 2023. YourCX. All rights reserved — Design by Proformat
