

- Research platform
Sources of information
Data analysis
Actions

- Solutions
For whom
Problems / Issues

- Materials
Materials
- About us
About us
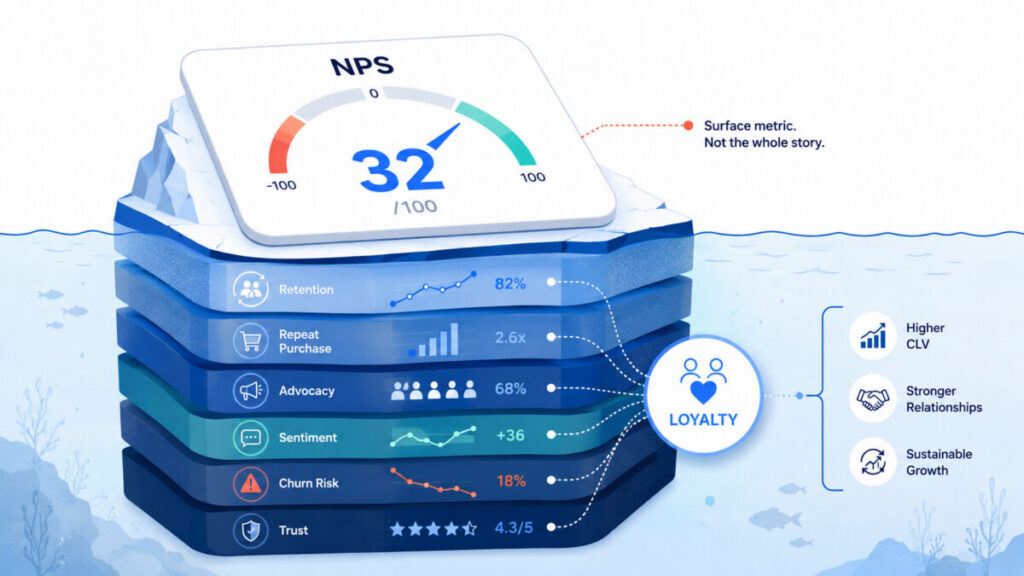
Net Promoter Score (NPS) is nearly ubiquitous as the go-to gauge for customer loyalty across industries. But while it's simple and widely adopted, NPS alone tells an incomplete—and sometimes misleading—story about actual customer retention and loyalty behaviors. Overreliance on this single metric can mask churn risks and shut out richer drivers of customer experience. Integrating broader loyalty metrics provides clearer, more actionable insights for sustainable retention.
NPS works by asking a single question: "How likely are you to recommend us to a friend or colleague?" Customers respond on a 0–10 scale. Net Promoter Score is then calculated by subtracting the share of detractors (0–6) from promoters (9–10), while passives (7–8) are ignored.
At a high level, this simplicity is a virtue—easy to benchmark, straightforward to communicate. But in measuring true customer loyalty, this one-number approach falls short:
Supporting research: Multiple independent studies have questioned how tightly NPS correlates with actual retention and revenue outcomes. In practical application, the metric is all too often detached from behavioral data—routinely flagging “success” even as customer leakage continues beneath the surface.
In sum: NPS doesn’t capture the subtlety, journey-phase specificity, nor the root causes needed for real customer loyalty analysis.
When CX teams, marketers, or executives make NPS their north star, several risks quickly surface:
These challenges leave organizations fighting churn reactively—or misallocating retention investments—because they lack the granularity needed for targeted action plans.
A robust Voice of Customer (VoC) program trades single-metric myopia for multidimensional insight—combining direct feedback, behavioral analysis, and sentiment intelligence.
Customer Satisfaction (CSAT): Directly probes how happy a customer is with a specific transaction, interaction, or journey stage. Unlike NPS, CSAT surfaces immediate service breakdowns and can pinpoint where experiences fall short.
Customer Effort Score (CES): Gauges how easy (or difficult) it was for a customer to accomplish a task—like resolving a problem or completing a purchase. Research consistently shows lowered effort is strongly correlated with retention, especially in service industries.
Where they help:
What NPS misses: Both CSAT and CES offer sharper root-cause clues—what’s breaking, where, and for whom—enabling data-driven interventions often invisible in NPS alone.
Direct observation of customer behavior delivers tangible indicators of loyalty:
Key point: These metrics ground loyalty measurement in what actually happens, making it possible to segment, quantify, and forecast how experience improvements drive revenue.
The real world of loyalty rarely fits in neat survey boxes. Unstructured feedback—text comments, call center transcripts, social mentions—contains nuance that structured surveys routinely miss.
Net-net: These advanced loyalty measurement tools amplify signal, reduce noise, and bring depth impossible with NPS alone.
Serious retention management begins with a structured, transparent measurement framework. Integrating NPS contextually—while prioritizing behavioral and emergent feedback—yields a much sharper, operationally relevant view.
Sample Framework: Quantitative and Qualitative Integration
| Metric | What It Measures | Pros | Cons | Best Use Cases |
|---|---|---|---|---|
| NPS | Likelihood to recommend | Benchmarkable, simple, high-level | Oversimplifies, lacks root causes | Board/C-suite trends, culture |
| CSAT | Transaction satisfaction | Journey specificity, quick signal | Lacks predictive reach | Service recovery, QA loops |
| CES | Perceived friction/effort | Strong retention link, tactical actio | Less applicable for some journeys | Digital onboarding, support |
| CLV | Revenue by customer | Ultimate tie to ROI, segmentation | Requires robust data, lagging | Account prioritization |
| Repeat Rate/Churn | Actual retention | Hard outcome, segmentable | Post-facto, but can be predictive | Success measurement, ops tuning |
| Text/Sentiment | Qualitative experience | Depth, nuance, root-cause mapping | Requires analytics capability | Emerging issues, trend spotting |
Checklist for Measurement Implementation:
Data only changes outcomes when operationalized. Translating loyalty metrics into effective retention requires discipline and a CX-centric mindset.
Best Practices:
Common Mistakes:
Decision criteria for weighting metrics:
Case 1: A digital retailer supplementing NPS with repeat purchase and CES notice that their NPS remains stable year-over-year, even as repeat purchase rates fall. Deeper behavioral analysis reveals a segment of "silent quitters"—passives who opt not to complain, but shop less frequently. Using CES at checkout and post-support reveals friction in returns and customer service. Removing those obstacles, not just seeking higher NPS, delivers a 10% lift in repurchase rates within six months.
Case 2: A B2B technology provider overlays NPS with account-level CLV tracking. They notice that even promoters sometimes reduce spend or churn during product upgrade cycles. By combining NPS with CLV drift analysis and gathering structured comments during key renewal windows, they proactively intervene with at-risk high-value accounts, reducing annual churn without over-investing in promoter engagement.
Case 3: A regional bank pilots post-interaction CSAT and open-text analytics alongside their NPS. While NPS signals strong overall sentiment, text analysis flags growing mentions of slow loan approvals in two regions. Targeted process improvements reduce complaints, leading to measurable drawdown in account closures six months later—results signaled far sooner than with NPS alone.
Common thread: All three organizations found that augmenting NPS with granular, behavior-linked, and qualitative measurement enabled them to surface root-cause insights—and convert data into tailored retention interventions.
NPS oversimplifies complex loyalty dynamics, ignores key segments like "passives" (often at highest risk of churn), and gives little actionable detail to inform retention or CX improvements.
Metrics such as Customer Lifetime Value (CLV), Repeat Purchase Rate, Churn Rate, CSAT, and CES offer more direct insight into customer retention and satisfaction—and their underlying drivers.
The most effective approach combines NPS with behavioral data, satisfaction/effort surveys, and qualitative feedback (such as open text and sentiment analysis), all tailored to the business model, journey stages, and data maturity.
No. NPS can still add value as a pulse-check or external benchmark, but works best when one input in a broader, action-focused loyalty measurement framework.
Close the feedback loop by assigning clear ownership; segment insights to reveal granular trends; prioritize at-risk segments; and measure the impact of interventions on behavioral outcomes, not just survey scores.
Advanced text and sentiment analytics extract actionable insights from qualitative feedback—surfacing pain points and opportunities for proactive intervention that standard NPS surveys routinely miss.
Key Takeaways: NPS has value as a directional signal, but treating it as the definitive loyalty metric exposes organizations to hidden churn, illusory performance, and missed opportunity for CX-driven growth. A modern approach to customer loyalty and retention integrates NPS with complementary satisfaction, effort, and behavioral metrics—and, crucially, leans into unstructured feedback and predictive analytics. Closing the measurement-action loop is what ultimately converts data into loyalty, and loyalty into market advantage.
Copyright © 2023. YourCX. All rights reserved — Design by Proformat
