Home / Blog / Unlocking the ROI of Customer Experience: A Data-Driven Approach for E-commerce
Unlocking the ROI of Customer Experience: A Data-Driven Approach for E-commerce
09.06.2026
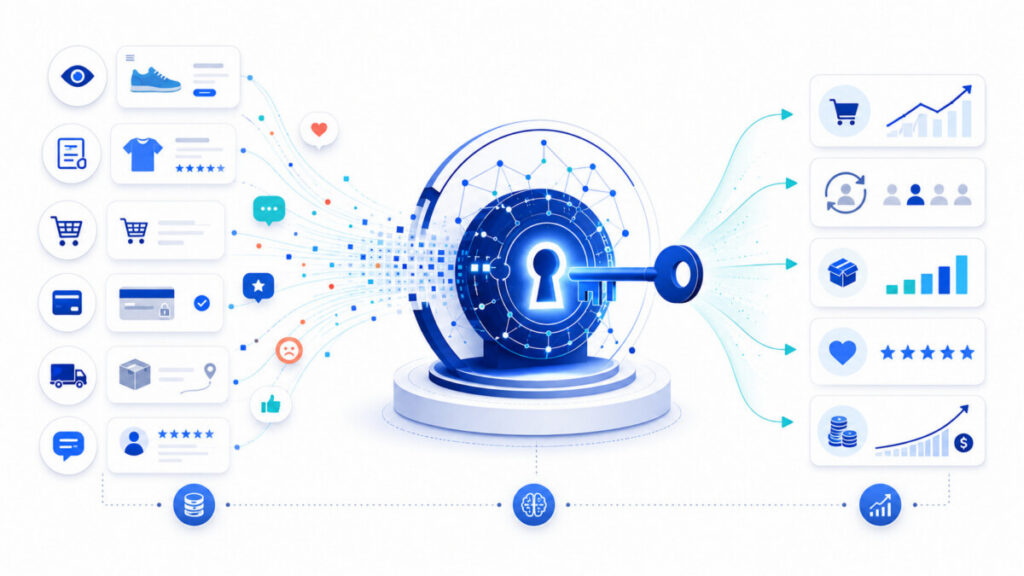
Quantifying the ROI of customer experience in ecommerce is no longer just a marketing aspiration—it’s a P&L necessity. As ecommerce margins thin and competition intensifies, the ability to tie CX improvements directly to financial outcomes separates durable ecommerce brands from churn-prone experimenters. Businesses that architect their customer experience strategies around robust, data-driven metrics are finding clearer pathways from analytics to action: higher retention, richer customer satisfaction, revenue growth, and analytics that actually shape decisions—not just dashboards.
What matters most
Directly link CX metrics to ROI: Tracking customer experience metrics only pays off if they reveal clear connections to retention, CLV, or revenue outcomes.
Focus on decision-ready analytics: Prioritize real-time, actionable ecommerce analytics over generic or lagging KPIs.
Customer satisfaction is a lever, not just a goal: High satisfaction feeds repeat purchase behavior, but only when paired with measurable follow-up and operational improvements.
Beware technical bottlenecks and data silos: Integrate data sources—from VOC platforms to transaction logs—for a unified analytics stack.
Mature brands move from “measuring” CX to “operationalizing” it: Optimization cycles, cross-functional teams, and revenue attribution models differentiate industry leaders from followers.
Understanding the ROI of Customer Experience in Ecommerce
Customer experience is only as valuable as its measurable impact. The ROI of CX, in the ecommerce context, refers to the quantifiable financial return generated by systematic improvements to every stage of the customer journey.
The conceptual equation is simple:
> ROI of CX = (Financial Value Attributable to CX Initiatives – CX Investment Cost) / CX Investment Cost
But the implementation is complex. Most ecommerce executives face two persistent CX measurement challenges:
Quantitative Measurement: Translating NPS, satisfaction, or effort scores into predictive drivers of revenue, CLV, or reduced churn. This typically involves connecting feedback data to first-party behavioral analytics, often across fragmented platforms.
Qualitative Measurement: Capturing non-numeric signals—emotion, anecdotal feedback, or friction in service touchpoints—which, while less easily quantified, often surface root causes of conversion blockers or pain points.
Strategically, winning teams align CX initiatives to clear business goals: lower acquisition cost, higher frequency of repeat purchase, lower customer service cost, or market-differentiating loyalty. This isn’t about chasing a higher NPS for its own sake; it’s about documenting which interventions—be it same-day fulfillment, proactive outreach, frictionless checkout, or better reviews management—yield measurable commercial payoff.
In essence, unless your CX measurement system traces investment to incremental net margin, cost reduction, or future revenue, it won’t get budgetary traction with leadership or move the competitive needle.
Core Ecommerce Analytics That Drive CX Value
Best-in-class ecommerce teams don’t swim in data—they architect the right pipelines. The analytics that most reliably expose ecommerce CX value fall into a handful of proven categories:
1. Conversion Rate
Definition: The percentage of visitors who complete a desired action, typically a purchase.
Why it matters: Conversion lifts reflect structural improvements to CX—such as faster loading times, better product search, smart recommendations, or transparent delivery policies.
CX Insight: If a major CX intervention (redesigned checkout, improved mobile UX) launches and conversion rates don’t shift across key segments, either the impact is lagging or the enhancement missed the real friction point.
2. Churn Rate
Definition: The percentage of customers who stop purchasing or engaging over a defined period.
CX Link: High churn signals unresolved pain points or unmet expectations, often even before satisfaction scores flag trouble.
Measurement: Churn is best measured via cohort analysis and requires integrating transactional and post-purchase feedback data.
3. Net Promoter Score (NPS)
Definition: A measure of customer advocacy derived by asking, “How likely are you to recommend us?” on a 0-10 scale.
Limitations: NPS is useful but incomplete. Without tying promoter and detractor rates to CLV or repeat buying, it risks being a vanity metric.
Best Use: Pair NPS tracking with segmentation—do promoters actually purchase more and churn less, or does high advocacy mask price sensitivity or segment-specific issues?
4. Customer Lifetime Value (CLV or LTV)
Definition: The total expected profit from a customer over their relationship with your brand.
CX Gold Standard: If a CX change demonstrably raises CLV—by increasing order frequency, AOV, or tenure—this is unambiguous ROI.
Data Requirements: Requires rigorous pipeline hygiene, often merging ecommerce transaction logs with CRM and historical VOC data.
5. Customer Effort Score (CES)
Definition: Measures how easy or difficult it was for customers to resolve an issue or complete a transaction.
Application: Low effort correlates directly with loyalty and reduced support cost. If your “resolved on first contact” scores are high, but CES is tanking, you’re solving the wrong problems.
Data Sources & Infrastructure
Transaction logs: Reveal granular buying patterns and post-intervention lift.
Behavioral analytics: Tracks navigation, dropoffs, and pain points across web/mobile.
VOC (Voice of Customer) platforms: Integrate surveys, reviews, and open-text feedback—crucial for uncovering what numbers alone miss.
The throughline: Each metric must roll up to business-critical outcomes: higher margin, stronger retention, lower cost to serve, or increased lifetime value.
Mapping Customer Satisfaction to Retention and Revenue
Satisfaction isn’t just a customer service KPI—done right, it's a revenue driver.
Direct Correlations
Empirical CX research shows that even marginal improvements in customer satisfaction are strongly associated with reduced churn and elevated repeat purchase rates. In ecommerce, a small uptick in post-purchase satisfaction often translates to an outsized impact on future buying:
Repeat Purchases: Satisfied customers convert at higher rates during subsequent visits, less sensitive to price volatility or minor friction.
Churn Reduction: Dissatisfaction compounds; a single poor experience can shift a high-value segment to competitor brands, often irrecoverably.
Case Evidence
While figures vary by category, several published sector studies highlight:
“Satisfied” or “Very Satisfied” customers in top-decile ecommerce brands regularly post double the repurchase rate of those rating their experience as “Neutral” or below.
CX leaders in repeat-purchase categories (skincare, subscription retail, specialty food) show measurable reductions in customer churn post-implementation of closed-loop feedback and rapid remedy processes.
Real-Time Monitoring & Improvement
Best practices for sustaining high satisfaction (and its retention benefits):
Closed-loop feedback: Immediate follow-up on negative feedback; public apology and visible solution for major service failures.
Real-time sentiment analysis: Leverages AI or VOC platforms to flag dissatisfaction spikes by journey phase—checkout, delivery, returns.
Proactive customer service: Outreach to resolve friction or answer unvoiced concerns often builds both loyalty and valuable data for operations teams.
The tactical lesson? Don’t just measure satisfaction—connect it, in your analytics stack, to LTV progression and churn suppression, and act on anomalies at internet speed.
Connecting CX Metrics to Financial Outcomes
The credibility of CX measurement rises in direct proportion to its traceability to the bottom line. Too often, however, CX dashboards—no matter how sophisticated—stop at sentiment, failing to close the loop to dollars and cents.
Framework for Attributing CX to Revenue
The standard approach is rooted in period-over-period analysis:
Establish Baseline: Measure revenue, conversion rate, CLV, and churn for a representative cohort before a CX intervention.
Launch Initiative: Introduce the CX optimization—faster checkout, new loyalty program, personalized communications, etc.
Isolate Variables: Where possible, use A/B or multivariate testing to distinguish CX impact from seasonal or marketing noise.
Track Financial Uplift: Compare CLV, incremental revenue, or margin for affected cohorts—adjusted for campaign, channel, or macro factors.
Example Calculation: Suppose you implement a CX-driven redesign reducing cart abandonment by 10%. If your average abandoned cart value is $75, and you process 10,000 carts a month:
> Added Monthly Revenue = (Abandoned Carts) x (% Reduction) x (Avg Cart Value) > > = 10,000 x 10% x $75 = $75,000/month
Subtract the cost of the UX redesign and any ongoing operational expense to estimate ROI.
Attribution Challenges
Lag Time: Some CX effects on retention or CLV may take quarters to surface. Over-indexing on short-term lift can obscure deeper, slower-burn gains.
Causal Ambiguity: Not every correlation between CX uplift and revenue denotes causation; robust segmentation and analytics guard against false attribution.
What mature organizations do: Treat attribution models as dynamic—revising assumptions, running incremental analyses, and refusing to let one metric dictate strategy.
Implementing Data-Driven CX Optimization in Ecommerce
Translating insight to action requires process discipline and technical savvy. Here’s a staged approach for ecommerce teams ready to graduate from passive reporting to active CX management.
1. Define Success Metrics
Start not with “what can we measure?” but “what does success mean for our customers and our business?” Prioritize outcomes (churn, CLV, repeat purchases, advocacy) rather than just process (survey completion rates).
2. Build a Unified Data Layer
Integrate disparate data streams:
CDPs (Customer Data Platforms): Aggregate behavioral, transactional, and feedback data per customer.
BI Tools: Tableau, Looker, or Power BI enable journey-stage segmentation and anomaly detection.
CXM Suites: Qualtrics, Medallia, or InMoment for orchestrated, real-time VOC measurement and closed-loop workflows.
3. Operationalize Analytics
Automate alerting and routing: Key CX pain signals (e.g., sudden NPS drops in a high-LTV segment) should trigger workflow actions, not just monthly reports.
Close the loop: Ensure that every negative feedback triggers a documented outreach or operational root-cause review.
4. Build a Cross-Functional CX Analytics Team
Composition: Blend CX design, data science, product, and frontline service expertise.
Mission: Align on common KPIs, reporting cadence, and the ownership for actioning insights—not just surfacing them.
Governance: Regular steering reviews prevent “data for data’s sake” and focus resource on high-ROI interventions.
5. Iterate and Scale
Pilot, measure, expand: Apply small-scale, measurable experiments before investing in system-wide CX changes.
Benchmark and revisit: What works this quarter may fade as buyer preferences evolve; continuous benchmarking against both internal and external CX standards is essential.
In practice, the differentiator isn’t access to analytics—it’s the discipline to act, test, and revise swiftly.
Common Pitfalls and Decision Factors in CX Measurement
Even seasoned teams fall into classic traps that dilute the financial value of their CX programs. Knowing where these efforts typically break down is crucial for sustained improvement.
Misinterpreting Metrics Without Financial Linkage
Mistake: Celebrating rising NPS or satisfaction without verified correlation to retention or CLV.
Remedy: Tie each improvement to revenue or cost reduction. Segment by value—not just volume—of responses.
Overreliance on Vanity or Lagging Metrics
Mistake: Chasing traffic, likes, or average ratings—irrelevant if they don’t shift your core financial levers.
Remedy: Prioritize actionable VOC, conversion, repeat rate, and churn as true north indicators.
Resource Allocation: Acquisition vs. Retention
Trade-Off: Over-investing in top-funnel acquisition (paid ads, SEO) at the expense of service quality and retention.
More mature brands: Eventually outgrow this phase, recalibrating toward lifetime value and margin over mere scale.
Data Privacy and Compliance Constraints
Watchout: Recent data privacy regulations (GDPR, CCPA) create new friction for customer data collection and analysis.
Best Practice: Design VOC and analytics programs for explicit consent and transparent, value-adding data use. Anonymize and aggregate wherever possible.
In short: Every metric is only as valuable as the action—and revenue impact—it catalyzes.
Data-Driven CX Metrics Success Checklist
Below is a distilled checklist for evaluating your ecommerce CX metrics program:
Component
Best Practice
Example Tools/Approach
Direct Outputs
KPIs
- CLV, Churn, NPS, CES, Conversion
—
Revenue attribution, prioritization
Data Sources
- Unified CDP, VOC platform, CRM
Segment, Amplitude, Medallia
Cross-journey analytics
Data Quality
- Real-time integration, audit trails
Data engineers, robust ETL pipelines
Reliable dashboards
Benchmarks
- Industry satisfaction and churn norms
3rd party CX benchmark reports
Contextualized goal-setting
Cadence
- Weekly core KPI review; monthly deep dive
Automated reports & workshops
Early intervention, learnings sharing
Action Mapping
- Each metric owned and actioned
KPI ownership tied to product/ops
Accountability, closed feedback loops
Practical targets for an established ecommerce operation:
CLV growth: >10% YoY for core segments
Churn rate: <5%/quarter on high-value cohorts
NPS: Top quartile in your category
First contact resolution: >85% of support interactions
Satisfaction at key journey stages: >4.5/5
Review KPIs weekly for trend shifts, and map an explicit action plan to each anomaly or opportunity surfaced.
FAQ
How do you calculate the ROI of customer experience in ecommerce?
To calculate the ROI of customer experience, identify the financial value generated by a CX initiative (such as higher retention or lower churn), subtract the implementation cost, and divide by the cost:
> ROI of CX = (Net Financial Benefit – CX Investment Cost) / CX Investment Cost
Track metrics both before and after interventions—over sufficient periods to capture lagged effects—and attribute incremental gains to the CX improvements wherever possible.
What ecommerce analytics are most important for measuring CX performance?
The most revealing CX metrics in ecommerce include Net Promoter Score (NPS), Customer Lifetime Value (CLV/LTV), churn rate, Conversion Rate, and Customer Effort Score (CES). Use these in combination, not isolation, and tie improvements to known revenue levers for a complete performance view.
How does customer satisfaction translate to higher ecommerce revenue?
Higher customer satisfaction increases retention, frequency of repeat purchases, and positive word-of-mouth. Satisfied customers not only buy more often but also cost less to serve and are less sensitive to competitor offers, translating directly to long-term revenue and margin growth.
What are common mistakes businesses make when using CX metrics?
The most frequent pitfalls are measuring satisfaction without linking to financial performance, fixating on vanity metrics (traffic, likes), over-relying on lagging indicators, and ignoring the feedback loop between insight and operational action. Siloed data and weak attribution also undermine CX gains.
Which tools best support real-time CX optimization in ecommerce?
Leading solutions include Customer Data Platforms (Segment, Amperity), behavioral analytics (Heap, Amplitude), and CXM/VOC platforms (Medallia, Qualtrics, InMoment) that integrate real-time feedback, orchestrate closed-loop workflows, and empower journey mapping with actionable intelligence.
How can you balance short-term gains with long-term CX investments?
Pursue quick-win CX improvements—such as resolving major checkout friction or automating support FAQs—while investing in longer-term foundations like unified data, personalization infrastructure, and rigorous root-cause analytics. Use pilot programs to validate high-ROI initiatives before broad investment, and always monitor both tactical and strategic KPIs.
Maximizing the ROI of customer experience requires more than measurement—it takes continuous operationalization, financial linkage, and a commitment to act on every insight. Data-driven CX analytics are your competitive edge; transformational revenue is the prize for those who wield them well.