

- Research platform
Sources of information
Data analysis
Actions

- Solutions
For whom
Problems / Issues

- Materials
Materials
- About us
About us
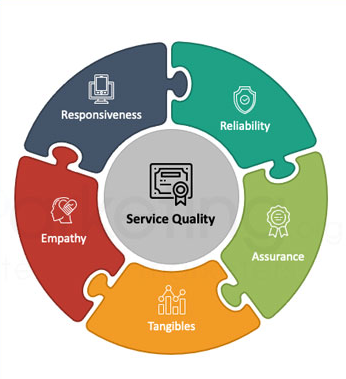
The SERVQUAL model is a research tool for assessing service quality by comparing customers' expectations with their perceptions of the services actually received. Developed in the 1980s by Parasuraman, Zeithaml and Berry, the model is based on five dimensions of service quality:
The SERVQUAL model is applicable to a wide variety of service sectors, from hospitality to banking to health and education services. Examples of application include:
The use of this tool makes it possible to identify so-called gaps, or five moments critical to the final verdict on the quality of services provided. These gaps reveal areas for improvement and show what actions and to what extent should be carried out to improve them.
The Servqual method, considered a benchmark in assessing service quality, stands out from other customer satisfaction analysis tools. Its foundation is the analysis of consumer expectations, which is a key contributor to a deeper understanding of their requirements and preferences. In addition, Servqual is characterized by simplicity of implementation and generates precise data necessary to optimize service standards.
Despite its strengths, Servqual faces some caveats. Challenges to its application include the time-consuming nature and potential costs, which can be particularly acute in sprawling organizational structures. Also, the method's adaptability to a variety of market sectors is debatable due to differing customer expectations and the nature of the services provided.
Another point of contention is the voluminous nature of the survey questions, which can burden respondents, reducing the value of the data collected. A questionnaire that is too long can result in inaccurate responses when survey participants skip questions or answer them imprecisely. As a result, more concise evaluation methods that focus on essential elements of service quality are recommended.
Alternative strategies include reducing the length of the questionnaire, intensifying direct contact with customers, applying modern technology to dynamically collect information, or analyzing users' emotions on social media. Such approaches can offer more effective and efficient solutions in measuring and improving service quality, to the benefit of both companies and their customers.
The market offers a number of alternative techniques for assessing service quality that can bring significant benefits to a variety of sectors. Methods such as the Net Promoter Score (NPS), the Customer Satisfaction Index (CSI), and the Customer Effort Index (CES) stand out for their specificity and can provide valuable insights into customer perception of service.
A comparative analysis of the Servqual method with other measurement techniques, in terms of their effectiveness and usefulness, is crucial in the decision-making process regarding the selection of the most appropriate research tool. Due to the lack of a universal solution for measuring service quality, it is advisable to consider a variety of methods thoughtfully in order to find one that best suits the needs and characteristics of a particular organization.
Suppose a hotel chain wants to evaluate the quality of its services at different locations. The survey could proceed in several steps:
Designing the questionnaire: Creating a questionnaire based on the five dimensions of the SERVQUAL model, asking about both expectations and hotel guests' perceptions of services.
Data collection: Handing out questionnaires to guests at check-out or sending online surveys after their stay. Responses could be rated on a scale of 1 to 7, where 1 means "strongly disagree" and 7 means "strongly agree."
Data analysis: Calculate the difference between expectations and perceptions for each dimension. Negative values would indicate gaps in service quality, while positive values would indicate exceeding customer expectations.
Interpret the results and make changes: For example, if the largest gaps appeared in the "Responsiveness" dimension, the hotel could focus on training staff in speed and efficiency of service.
Complementing the quantitative results are responses to additional questions about comments and rating comments. The use of automated analysis of the statements allows us to quickly capture the most significant reasons for the ratings of each area.
You can read more about automation of customer feedback analysis here: https://yourcx.io/en/open-ended-questions-analysis/
The SERVQUAL model is flexible and can be tailored to the specifics of a particular industry or a specific area
Copyright © 2023. YourCX. All rights reserved — Design by Proformat
