Home / Blog / Optimizing the E-commerce Customer Journey: Data-Driven Approaches to Increase Conversions
Optimizing the E-commerce Customer Journey: Data-Driven Approaches to Increase Conversions
22.05.2026
Analytics has redefined what’s possible in e-commerce conversion optimization, shifting from gut-feel tactics to measured, repeatable processes. By systematically mastering the customer journey with granular ecommerce analytics and evidence-based experimentation, brands can diagnose friction, personalize experiences, and continually raise conversion rates—often unlocking opportunities invisible to the naked eye. The true advantage lies not just in tracking activity, but in turning that data into strategic, cross-functional action.
What matters most
Break the journey into granular stages and measure everything: Effective optimization starts by mapping every customer interaction and documenting friction.
Use advanced analytics tools beyond page views: Behavioral data—heatmaps, funnel drop-offs, session recordings—reveal intent and hesitation.
Test with discipline, not randomness: Hypothesis-driven A/B and multivariate experiments reduce noise and expose what actually moves the metric.
Balance fast experimentation with deep audience research: Know when to let data lead, and when to dig into customer motivations first.
Prioritize customer experience as much as conversions: Short-term wins that harm brand trust or post-purchase delight rarely sustain.
Deconstructing the E-commerce Customer Journey for Conversion Optimization
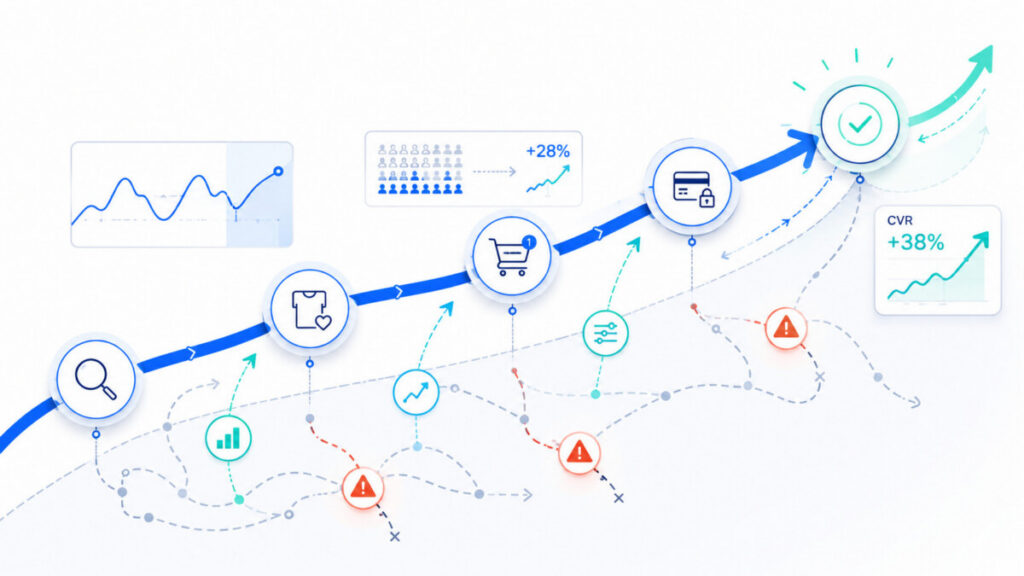
The e-commerce customer journey is rarely linear. Effective conversion optimization begins by breaking down this journey into identifiable, measurable stages:
Product Discovery: How users arrive (ads, search, referrals). Friction: irrelevant landing pages, poor site speed, unclear value proposition.
Research and Evaluation: Comparing products, reading reviews, FAQ engagement. Friction: incomplete product information, weak images, missing trust signals.
Checkout: Inputting details, payment, confirmation. Friction: too many form fields, lack of payment options, distracting upsells.
Post-Purchase: Order updates, support requests, re-engagement. Friction: vague confirmation, late deliveries, missing feedback opportunities.
Why granular journey mapping matters
Most conversion losses happen in the wiry tangle between these stages—not at the obvious, final click. For instance, a high cart abandonment rate often points upstream to disappointment during product research, or friction with adding/removing variants. Similarly, weak post-purchase experiences quietly undermine repeat conversion potential, even when 'conversion rate' dashboards look healthy.
Best practice: Use event tracking and funnel analysis to tie micro-interactions (hover, scroll, add-to-cart, save-for-later) to key conversion stages. Document these meticulously. Every unmeasured touchpoint is a blind spot.
Advanced Ecommerce Analytics: Tools and Metrics for Deeper Insights
Surface-level site metrics—traffic, average session duration—rarely guide conversion optimization. Modern e-commerce analytics demands a layered approach:
Core analytics tools
Google Analytics (GA4): Standard baseline for measuring acquisition, behavior, conversion, and custom events.
Mixpanel or Amplitude: Product analytics built for granular funnel, cohort, and retention analysis.
Customer Data Platforms (CDPs): (Segment, BlueConic, etc.) Centralize user-level data for richer segmentation and orchestration.
Metrics and their diagnostic value
Bounce Rate: High on landing pages can signal mismatched ad-copy or slow loading times.
Exit Pages: Where are users most likely to give up? Pages with high exit rates often hide unexpected usability or content issues.
Funnel Drop-off Points: Track drop-offs stage-by-stage (e.g., Product > Cart > Checkout > Purchase). This surfaces where optimization attention should cluster.
Time on Page: Nuanced—long times can mean engagement or confusion, so pair with scroll or click data for context.
Conversion Rate: The lagging indicator—track both macro (purchase) and micro (email signup, add-to-cart) conversions.
Customer Lifetime Value (CLV/CLTV): The north-star for sustainable optimization—don't drive up first conversions at the expense of future margin.
Segmentation: Avoid the averages trap
Aggregate data buries vital signals. Segment analysis—by source, device, cohort, new vs returning, recency of last purchase—reveals where specific friction points strike hardest or where a redesign might hurt one group but help another. Mature teams never optimize to aggregate metrics alone.
Leveraging User Behavior Analytics to Decode Friction and Intent
Behavioral analytics tools make it possible to peer over the virtual shoulder of your site visitors, giving you evidence far richer than traffic counts or conversion rates alone.
How behavior analytics sharpens CX diagnosis
Session Recordings: Replay real user sessions to witness stutters, backtracks, and moments of confusion. True root-cause analysis; useful for both UX and customer service teams.
Clickmaps and Heatmaps: Visualize concentration of clicks, taps, and mouse movement. Quickly exposes whether CTAs, links, or product images actually draw attention—or are ignored.
Scrollmaps: Determine if key content and "buy" triggers sit too low, causing visitors to abandon before seeing them.
Funnel Analysis: Trace precise user paths through your main conversion funnel to identify where and why users vanish.
Examples of actionable insights
CTA Blindness: A heatmap reveals that most users never even see your primary CTA—possibly due to hero image size or mobile stacking issues.
Drop-off at Shipping Step: Funnel analysis uncovers most abandonment happens at the shipping information step, not payment—often due to unexpected shipping fees or poor estimate transparency.
Mobile Scroll Fatigue: Scrollmaps show mobile customers rarely reach product USPs buried below carousels and related items; responsive redesign or progressive disclosure required.
Behavioral analytics turn anecdote into evidence and anecdotes into action. Brands that excel here rarely rely on team intuition alone.
Systematic A/B Testing for Continuous Conversion Rate Improvement
Without disciplined experimentation, e-commerce optimization devolves into bias and busywork. A/B testing provides the statistical rigor to separate signal from noise.
A/B and multivariate testing: Definitions in context
A/B Testing: Randomly split traffic between two variants (A—the original, B—the challenger), altering a single element to identify impact—e.g., CTA text, image, or button color.
Multivariate Testing: Simultaneously tests multiple variations of several elements to measure interaction effects—better for high-traffic sites with complex hypotheses.
What to test—and what not to
Layout: Placement of images, trust badges, recommendations, etc.
Copy: Product headlines, value propositions, error messages.
CTAs: Text, color, position, animation.
Product Recommendations: Algorithm or logic powering upsells and cross-sells.
Images: Lifestyle vs product-only, number of image views, video integration.
Disciplined experimentation: steps and pitfalls
Form a hypothesis.
“We believe that adding shipping transparency earlier in the cart will reduce drop-off at the checkout step.”
Define measurable endpoints.
Not just 'conversion improves', but 'cart-to-checkout drop-off’ decreases by X%.
Randomize, isolate, and timebox.
Don’t overlap tests or change several variables at once unless you have statistically sufficient traffic.
Collect and interpret results.
Beware of statistical significance vs. business significance—impact size matters.
Document learnings.
A/B programs fail when lessons get lost between teams or are not embedded back into design and content guidelines.
Common A/B testing errors
Testing everything indiscriminately (“test and pray”).
Calling winners too early on low sample sizes.
Running tests during abnormal periods (holidays, outages, campaigns).
Ignoring post-purchase or long-term effects.
Two Approaches: Data-First Testing vs. Deep Audience Understanding
Conversion optimization is often characterized by two dominant—and sometimes competing—mindsets.
1. Iterative, Data-First Testing
Philosophy: Let aggregate behavioral data guide what to test, experiment frequently, and prioritize growth.
Strengths: Fast iteration, easy to scale, less prone to stakeholder preconceptions.
Drawbacks: Can fall into “local maxima”—refining what works for existing traffic, but blind to unmet needs and new segments.
2. Audience Pretesting and Persona-Led Deep Research
Philosophy: First invest in qualitative research, VoC (Voice of Customer) programs, persona interviews, and journey mapping. Build hypotheses around deep audience needs, then test.
Strengths: Yields richer hypotheses, uncovers low-frequency but high-value friction points, supports major redesigns and new brand directions.
Drawbacks: Slower, more resource-intensive; at times, over-indexes on anecdote or non-representative samples.
Decision criteria: When to use which approach?
Rapid incremental gains needed? Lean data-first, especially on mature, high-traffic pages where risk is low.
Redesigning journeys for new segments, launches, or lagging repeat rates? Invest in audience understanding, rigorous research, and pretesting.
Hybrid teams get this right: Start with VoC and behavior analytics to explore, then A/B test for validation and scale.
Decision Points, Trade-Offs, and Common Mistakes in Data-Driven Optimization
Data-driven conversion optimization isn’t foolproof or without consequences. Real progress requires hard choices, and the cost of missteps can be high.
Decision points and trade-offs
Short-term wins vs. long-term CX: Over-optimizing funnel stages (popups, urgency, 'dark patterns') may spike initial conversion but degrade brand trust, NPS, and repeat rates.
Automation vs. Personalization: Automated recommendations and emails increase efficiency, but hyper-personalization requires data hygiene, rigorous segmentation, and consent management—often overlooked.
Granularity vs. Usability: Excessively granular tracking (e.g., 50+ events per page) complicates analysis and hinders action if not meticulously governed.
Operational Realities: Every recommended change (e.g., new checkout UI) runs up against dev bandwidth, legacy systems, and stakeholder appetite for risk.
Common mistakes
Over-testing: Shotgun A/B testing without prioritization generates false positives and team fatigue.
Data misinterpretation: Correlating bounce rates with irrelevance, when in fact it’s site speed or campaign mismatch.
Neglecting post-purchase: No CX optimization is complete without measuring what happens after checkout (support pain, NPS, delivery friction).
Ignoring feedback loops: CX and analytics teams must share back learnings systematically, forming a closed loop that empowers future improvements.
Tips for practical balance
Regular “Test/Don’t Test” meetings grounding priorities in both business KPIs and customer insights.
Clear documentation: every test, its rationale, outcomes, and post-test actions.
Workflow discipline: technical QA before and after deploying variants, especially on core conversion flows.
Checklist: Building a Data-Driven Conversion Optimization Program
An effective program is systematic. Use this as a working framework:
Stage
Tools/Metrics
Decision Owner
Map customer journey
GA4/Amplitude, VoC data, feedback loop
CX lead, UX, data analyst
Set up analytics
Google Analytics, Tag Manager, CDP
Analytics lead, dev
Collect behavioral data
Hotjar, FullStory, surveys
UX designer, CX
Segment & analyze
Amplitude cohorts, funnel, heatmaps
Data analyst
Hypothesize & prioritize
Based on impact/effort, friction reps
Optimization manager
Run A/B/multivariate tests
Optimize, in-house tools, QA scripts
Product, dev, analytics
Interpret & document
Testing dashboards, wiki, post-mortems
All
Create feedback loop
NPS, CSAT, support data, VoC
CX, customer support
Iterate & automate
BI dashboards, decision logs
Product owner, ops
Tip: Stakeholder alignment at every phase prevents disruption, speeds up approval cycles, and keeps the focus on customer-centric priorities.
Enhancing CX for Long-Term Growth: Beyond the First Conversion
Conversion isn’t the finish line—it’s just the start of customer lifetime value. Market-leading brands turn to advanced customer experience optimization after the initial purchase to drive sustainable revenue.
Strategies that move the needle
Real-time, omnichannel support: Live chat, fast response SLAs, and context-aware help options decrease churn and accentuate perceived value.
Dynamic, personalized recommendations: Use browsing and purchase history for “next best offer.” Done poorly, this feels invasive or irrelevant; done well, it accelerates repeat purchases.
Mobile-first optimization: With mobile commerce dominant, responsive design, fast checkout, and clear mobile navigation can’t be afterthoughts.
Proactive feedback solicitation: Post-purchase NPS, CSAT, and review requests, tightly integrated with service recovery protocols.
Measurement: monitor more than just sales
CSAT and NPS: Track satisfaction and loyalty, not just conversion.
Repeat purchase rate: Direct signal of brand value and gap between one-time and long-term buyers.
Support pain index: Diagnosing where post-purchase journeys derail (returns, slow refunds, helpdesk friction).
Continuous improvement requires agility. Mature teams use agile sprints and embedded analytics to ensure that site, service, and journey innovations are genuinely customer-driven, not just features chasing industry noise.
FAQ
What are the key stages in the e-commerce customer journey?
Typical stages include:
Product discovery (how users find your store or products)
Research and evaluation (browsing, comparing items, reading reviews)
Cart addition (selecting and reviewing items for purchase)
Each step hosts unique pain points that can impact the ultimate conversion and lifetime value.
How can ecommerce analytics specifically improve conversion rates?
Ecommerce analytics uncovers where users drop off, which pages or experiences cause friction, and what content—or lack thereof—causes hesitation. By translating these insights into design tweaks (e.g., moving shipping info upfront), funnel redesigns, or personalized offers, teams can systematically remove obstacles and increase the likelihood of conversion.
What are best practices for effective A/B testing in online stores?
Form a hypothesis grounded in customer data, isolate variables, ensure proper randomization, run tests long enough for statistical significance, and document findings rigorously. Avoid overlapping tests on the same segments, and always validate that measurement is accurate via QA.
How do user behavior analytics tools differ from standard web analytics?
Standard analytics aggregate sitewide activity (traffic, bounce rate, sessions), while behavior analytics tools like Hotjar or FullStory provide session-level detail: click paths, heatmaps, user recordings, and direct evidence of frustration or confusion. These tools surface the “why” behind the “what.”
What common mistakes should marketers avoid in data-driven conversion optimization?
Frequent pitfalls include:
Over-testing or running too many low-impact experiments
Ignoring the post-purchase customer experience (support, delivery, re-engagement)
Relying solely on aggregate data instead of rich segments or behavioral context
Cutting short test durations and mistaking correlation for causation
How does the customer journey relate to conversion optimization?
Every optimization effort should start and end with the customer journey mapped clearly; without this, teams risk optimizing isolated steps at the expense of the holistic experience, reducing trust and ultimately undermining long-term results.
By rooting conversion optimization in disciplined analytics, customer journey mastery, and a culture of hypothesis-driven testing, e-commerce brands move from chasing shiny tactics to building compound, sustainable growth. When every change is anchored in real user behavior and tuned for the entire journey—not just the final click—conversion rates become both predictable and repeatable. And that’s where analytics finally pays its rent.