

- Research platform
Sources of information
Data analysis
Actions

- Solutions
For whom
Problems / Issues

- Materials
Materials
- About us
About us
In 2018, we collected 2,256,195 completed questionnaires from surveys of customers and their experiences at various points in the Customer Journey - whether within the online services and mobile apps, delivery processes or contact with the BOK. Respondents shared with us their opinions and impressions on various aspects related to the purchase process. We also asked most of them the enigmatic NPS question. Just what's next?
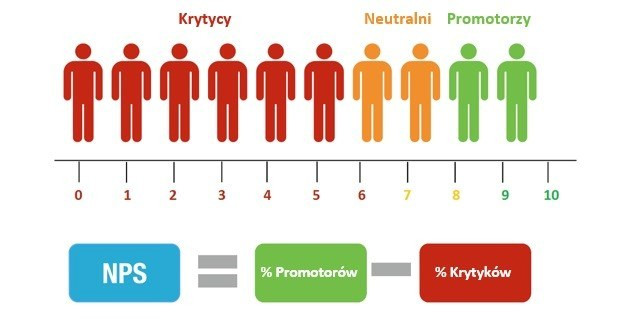
Net Promoter Score is a methodology for assessing consumer loyalty to support the Customer Experience Design process. The methodology asks one question: how likely are you to recommend a service, product, brand to your friends or family? Answers on a scale of 0 to 10 are then the basis for dividing consumers into three groups:
Detractors (ratings from 0 to 6) will not have a good opinion of you and will be reluctant to use your services again. This can be influenced by a number of negative experiences or one particularly nasty memory.
Passives (ratings of 7 and 8) will not speak negatively about you, but they will not recommend your services either. Instead, they won't hesitate to switch to a competitor if they find a cheaper or better personalized offer.
Promoters (ratings 9 and 10) will gladly whisper a kind word about your brand to family and friends. They buy more and more often, and your competitors will have more trouble pulling them over to your side.
The NPS index itself is the result of a simple mathematical operation: from the % of Promoters we subtract the % of Critics. The Passive group is left out.
It is worth remembering, however, that measuring relational NPS, i.e. analyzing loyalty to a brand or the company as a whole, is different from measuring transactional NPS, focused on experiences at specific stages of the Customer Journey. Customer satisfaction surveys must take into account the full context of who the consumer is and their goals, expectations and intentions.
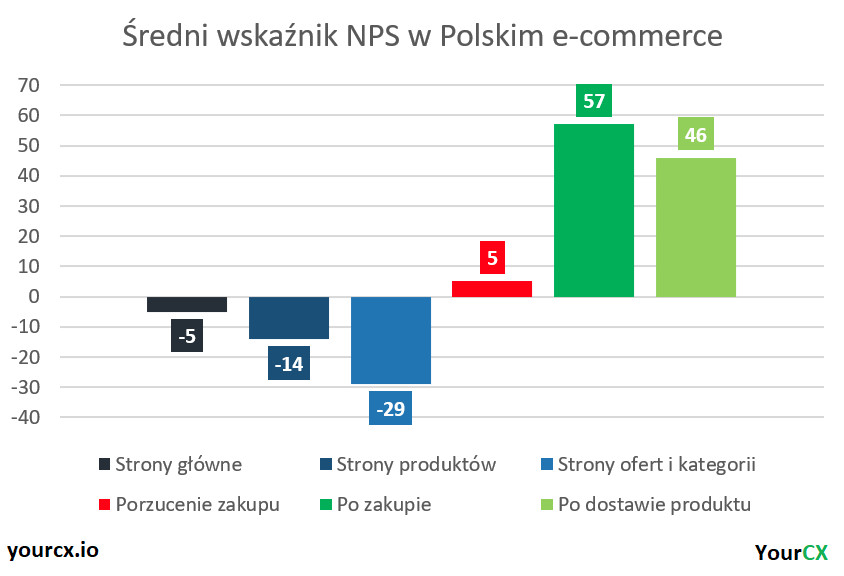
Thehome page of any e-commerce site is the company's business card. The first impression is important, but it's still too early to form a hard opinion of the brand. The average NPS at this stage of the customer's purchase path in 2018 is -5.
Product pages and category and offerpages evoke slightly more negative emotions. For the former we record an average NPS of -14, and for the latter: - 29. There are more factors negatively affecting the experience at the stage of familiarizing oneself with the offer and filling the shopping cart, hence the importance of monitoring the emotions surrounding these Customer journeys.
Finally comes the time of adding products to the shopping cart. At the shopping cart abandonment stage, the average NPS is slightly higher than on the product and category pages - in 2018 it oscillated around the value of 5. This means that potential Customers who are dissatisfied with what they see on the site do not even start to fill the shopping cart, let alone finalize the purchase.
Those who get through the shopping process and finally place an order are already characterized by much higher satisfaction, loyalty and willingness to recommend the brand. The average NPS index for this group was as high as 57. Of course, the thank you page goes to those whose previous negative experiences (technical errors, lack of product, unresponsive prices, problems with navigation, etc.) did not discourage them from completing the purchase. It is therefore important to monitor the reasons for leaving the purchase process - only user feedback will allow you to accurately identify the reasons why they do not place an order. Such a high post-trade NPS score can also be influenced by simple rationalization of expenses, but let's also not forget about the joy accompanying successful purchases.
Let's not forget that the shopping path does not end at the thank you page for placing an order. The process of delivery or personal pick-up may involve further problems, which most often the consumer will solve by contacting the BOK, with an even greater risk of losing it. As a result, the average NPS for delivery processes in 2018 is lower than that after purchase, at 46
The NPS indicator is a good way to measure customer loyalty and satisfaction, in fact it's one of the basic indicators of customer experience, but it has a very high risk - if we don't know the right context, we won't know what to do with it. Proper data analysis and consumer segmentation allows us to accurately optimize these emotions.
This process, by the way, is not limited to online processes. Investments made on the basis of YourCX data resulted in an increase in NPS by as much as 59 points over last year at one of the traditional outlets studied! Thus, constant monitoring of the experience allows us to verify the impact of our actions on customer satisfaction, and relating the NPS to the financial context allows us to know the real impact of the experience on the business.

We should not forget about yet another context that can affect the average NPS score in VOC (Voice of the customer) analyses, namely the nature of the services or products offered. In the 2018 Omnichannel panel study conducted by YourCX, we examined how Polish companies operating in nine distinct market segments are perceived. Detailed analysis of relational NPS for each industry in Poland can be found here, while for individual reports from this study, download here.
Before you start sending out NPS surveys, take a look at seven best practices for using NPS to measure and evaluate customer experience.
Want to get a baseline for your NPS score before launching customer loyalty surveys? Identify the exact customer touchpoints that can be included in your research and where customers have had recent contact with your company.
Perhaps they made a purchase in the last month, logged into your website in the last hour or downloaded your app in the last week. Recent experiences and customer engagement with your brand will result in better survey conversions and identify key elements for change.

Context is everything when it comes to analyzing Net Promoter Score reviews to make significant changes. If all the critics have bought something from a particular product line offered by your brand, it's worth looking at that product group. However, you will only find out if you actually know what product the customer bought.
When sending out surveys, include operational details, additional customer information, so you can use this data to later analyze results, develop business and improve customer experience. Each customer segment's experience will be quite different, so along with the surveys, gather the information you need for further in-depth analysis.
We all know the struggle of dealing with a full inbox, especially at the end of a work day or a long week. Sending surveys so that they arrive in customers' inboxes early in the week, when they first log in to check their emails, helps ensure that emails are seen and appropriate action is taken.
Even better is to send a gentle reminder a week later to anyone who hasn't opened a survey email - give them a chance to share their feedback in case they missed the first email.
People like solutions to be tailored to them. Update the subject line of your survey email to include the customer's name or refer to a product they recently purchased. This increases the likelihood of getting a response, and creates a bond with the customer that can only strengthen your brand. This will help you know the customer's satisfaction level.
Customers may give feedback repeatedly, but they will quickly stop taking the time if they realize that their feedback is not being addressed.
Try to respond to Critics within a day, Passives within three, and Promoters within five - ask for more details about what might have improved their experience, address specific concerns they mentioned, or thank them for their time and encouragement!
To engage your entire team in the NPS program, involve them in the process of handling and using feedback. Share the customer experience with them.
If your team uses Slack or other messaging software, set up automation to direct feedback to a dedicated channel where team members can get a boost from positive feedback and work together to resolve any negative issues.
As the voice of the customer is present in day-to-day operations, the team will make better decisions that improve the customer experience.
Do you need management endorsement? How about proof that detractors are less likely to make return purchases or that promoters abandon services with a 75% lower rate? By tying NPS to other KPIs that your team cares about, you can prove that customer experience really does have value and, for example, improves retention rates as well as provides sales growth.
The Customer Journey of a customer is made up of many stages that need to be monitored in order to improve. If you are interested in conducting Customer Experience research at various brand touchpoints to build positive relationships, we invite you to contact us and work with us. And if you want to know more about our approach to Net Promoter Score analysis, please visit our guide.
Copyright © 2023. YourCX. All rights reserved — Design by Proformat
